Analytics Workspace
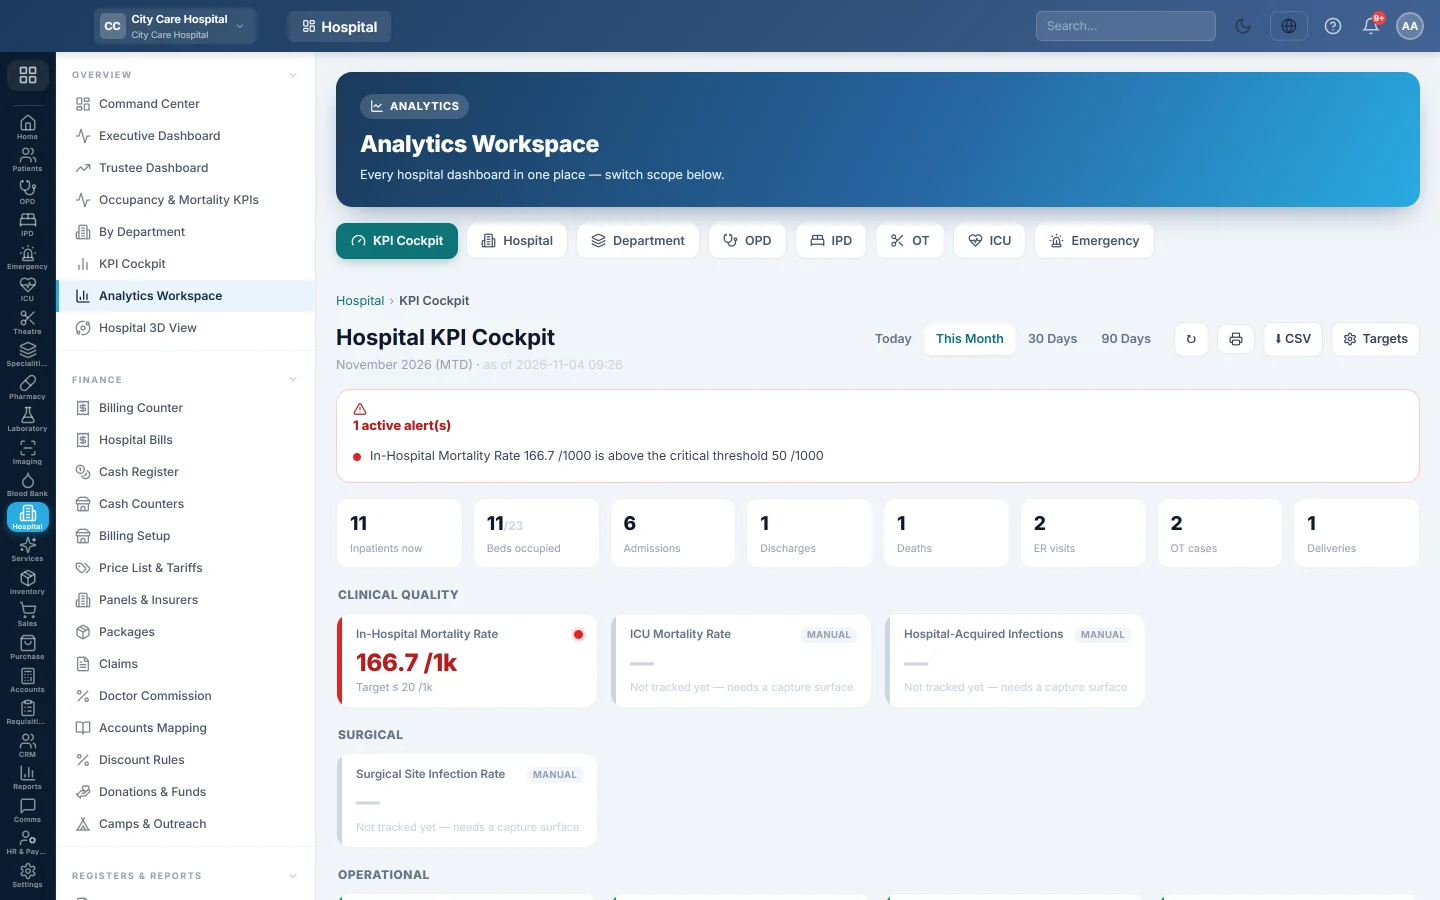
Every hospital dashboard in one place. Switch between the KPI Cockpit, the hospital, one department, OPD, IPD, theatre, ICU and emergency without leaving the page.
The Analytics Workspace puts every hospital dashboard behind one row of buttons. Pick a scope and its dashboard opens below.
Before you begin
- Each scope uses the same data and the same rights as its own dashboard page.
- The figures come from daily work, so a new hospital shows little until patients are seen.
Where to find it
Open Hospital → Overview → Analytics Workspace.
Switch scope
Click a button along the top:
| Scope | Opens |
|---|---|
| KPI Cockpit | Indicators against targets. See KPI Cockpit. |
| Hospital | The month's hospital figures. See Occupancy & Mortality KPIs. |
| Department | One department's month. See By Department. |
| OPD | The OPD dashboard. See OPD Dashboard. |
| IPD | The IPD dashboard. See IPD Dashboard. |
| OT | The theatre dashboard. See OT Dashboard. |
| ICU | The critical-care dashboard. See ICU Dashboard. |
| Emergency | The emergency dashboard. See ER Dashboard. |
The workspace opens on KPI Cockpit.
Common questions
Is anything here that is not on its own page? No. Each scope is the same dashboard as its own menu item; the workspace just saves clicks.
Which one should management watch? The Executive Dashboard is built for a wall screen; the workspace is for looking things up.
Can I print a scope? Use the print button on the dashboard itself, such as Print (A4) on the KPI Cockpit.
Merci. Si vous avez encore besoin d’aide, écrivez à info@eloerp.net.