OPD Dashboard
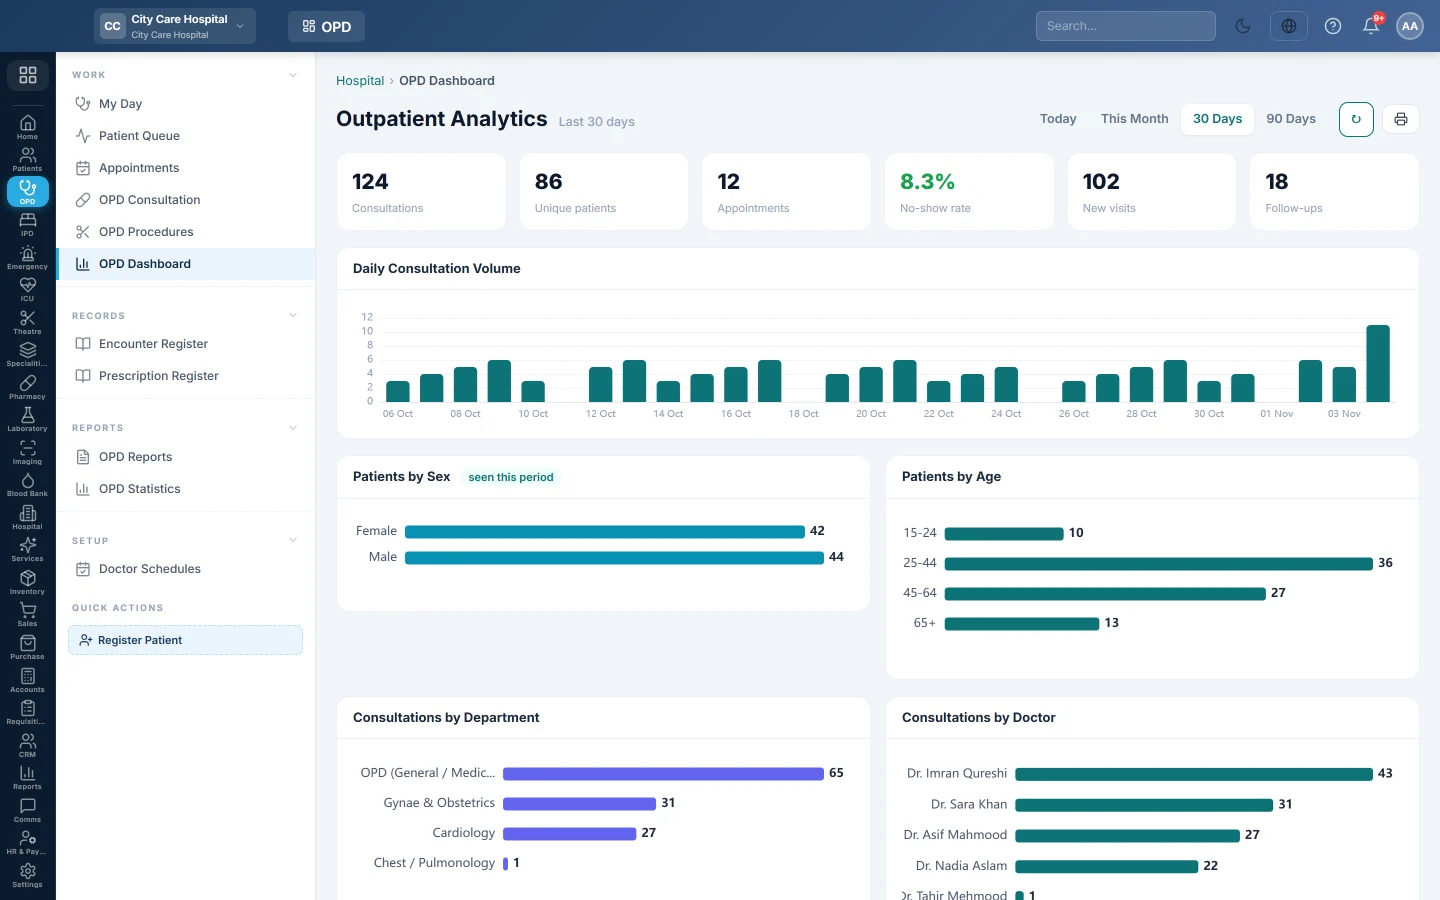
Outpatient analytics - consultations, unique patients, appointments and no-show rate, new and follow-up visits, with charts by day, sex, age, department, doctor and diagnosis.
The OPD Dashboard shows how busy the outpatient department is and who it sees. Managers use it to watch volume, no-shows and the most common diagnoses.
Before you begin
- Your role needs the clinical dashboards, hospital reports or appointment view permission. See Users & Roles.
- The figures come from signed and open consultations and appointments. Until there are any, the page says No OPD activity to report yet.
Where to find it
Open Outpatients (OPD) → Work → OPD Dashboard. The page is titled Outpatient Analytics.
Read the dashboard
- Pick the period: Today, This Month, 30 Days or 90 Days.
- Read the tiles: Consultations, Unique patients, Appointments, No-show rate, New visits and Follow-ups. A high no-show rate turns amber or red.
- Read the charts: Daily Consultation Volume, Patients by Sex, Patients by Age, Consultations by Department, Consultations by Doctor, Top Diagnoses and Appointment Status.
- Click ↻ to refresh, or the printer to print the dashboard.
Common questions
The no-show rate is blank. There were no appointments in the period, so there is nothing to compare.
Top Diagnoses is empty. Doctors have not added diagnoses to consultations in this period.
Where do I see the money side of OPD? On OPD Statistics, which shows collections by department, method and doctor.
Can I get these numbers as a table? Yes. The OPD Reports in the Reports Library can be printed or exported to CSV.
Thank you. If you still need help, write to info@eloerp.net.