Occupancy & Mortality KPIs
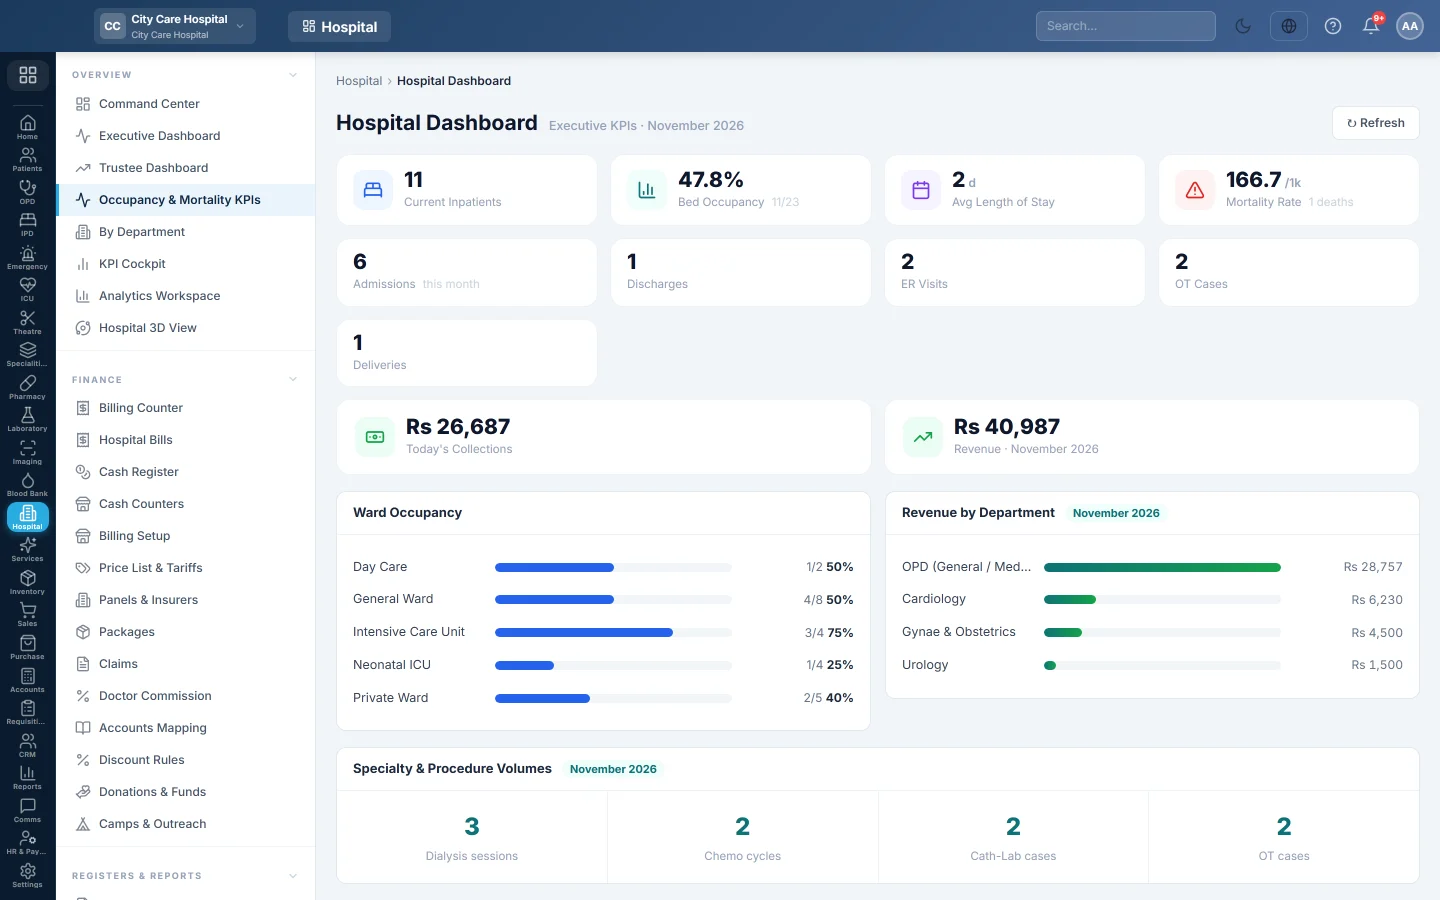
This month's hospital figures on one page. Inpatients, bed occupancy, length of stay, mortality rate, admissions, discharges, ER, theatre and deliveries, ward occupancy and revenue by department.
Occupancy & Mortality KPIs is a calm, one-page view of the current month: how full the hospital is, how long patients stay, the mortality rate and where the revenue came from. The page itself is titled Hospital Dashboard.
Before you begin
- The figures come from admissions, discharges, deaths, ER visits, theatre cases, deliveries and bills.
- Ward occupancy needs wards and beds. See Wards & Beds.
Where to find it
Open Hospital → Overview → Occupancy & Mortality KPIs. It is also the Hospital tab of the Analytics Workspace.
Read the page
The subtitle shows Executive KPIs and the month.
- Current Inpatients, Bed Occupancy, Avg Length of Stay and Mortality Rate (per 1,000, with the number of deaths).
- This month's Admissions, Discharges, ER Visits, OT Cases, Deliveries and Revenue.
- Ward Occupancy for each ward.
- Revenue by Department for the month.
- Specialty & Procedure Volumes, such as dialysis sessions or cath-lab cases.
Click Refresh to update.
Common questions
The page says it could not load. Your session may have expired. Sign in again and click Retry.
Revenue by Department is empty. No bills were posted this month yet.
Where do I compare with last month? On KPI Performance, which shows the prior period next to each KPI.
Thank you. If you still need help, write to info@eloerp.net.