Ratio Analysis
Liquidity, leverage, profitability and efficiency ratios worked out from your ledgers, with the figures behind each one.
Ratio Analysis turns your balance sheet and income statement into the ratios lenders and owners ask for: can you pay your bills, how much do you borrow, how profitable are you, and how fast does stock and credit turn over.
Before you begin
- Your plan must include the Balance Sheet; this report comes with it. If it is missing from the menu, your plan does not have it.
- The ratios are only as good as the books. Check that the Balance Sheet balances first.
Where to find it
Open Accounting → Reports → Ratio Analysis.
Run the report
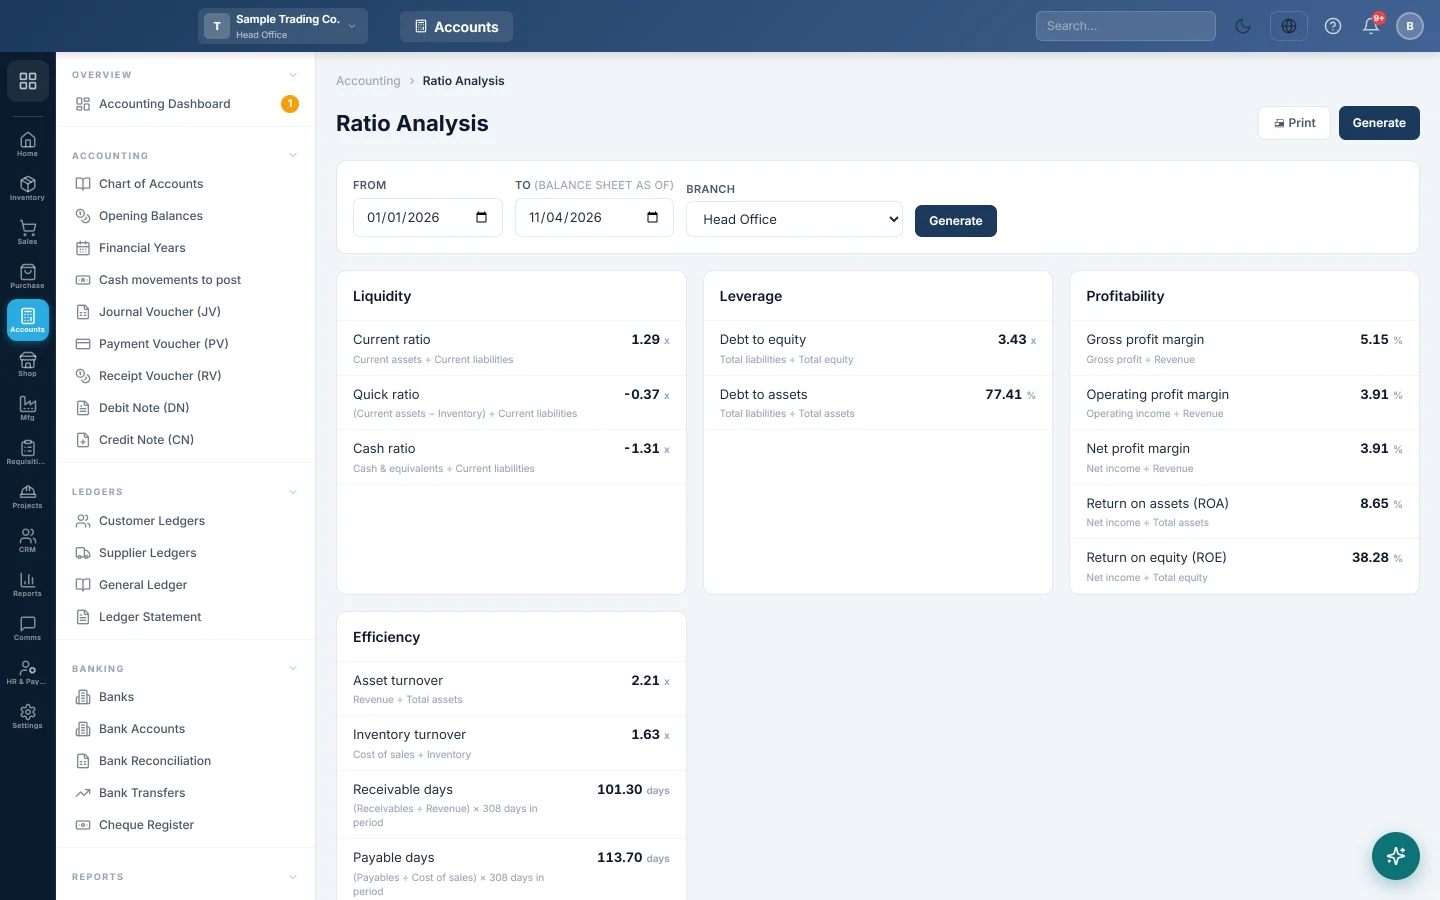
The report opens for 1 January of this year to today.
- Set From and To. Balance sheet figures are taken on the To date.
- If you work at head office, pick a Branch, or All Branches (Consolidated).
- Click Generate.
Read the ratios
Each card lists its ratios with the formula under the name.
| Card | Ratios |
|---|---|
| Liquidity | Current ratio, Quick ratio, Cash ratio: can current assets cover current liabilities? |
| Leverage | Debt to equity, Debt to assets: how much of the business is funded by borrowing. |
| Profitability | Gross profit margin, Operating profit margin, Net profit margin, Return on assets (ROA), Return on equity (ROE). |
| Efficiency | Asset turnover, Inventory turnover, Receivable days, Payable days, Inventory days. |
A value shown as n/a has nothing to divide by. For example, a business with no stock has no inventory turnover. That is different from a ratio of zero.
Days ratios use the number of days in your period, not a fixed 365. A period of 90 days gives receivable days over 90 days.
A worked example on the To date:
| Figure | Amount |
|---|---|
| Current assets | Rs 300,000 |
| Inventory | Rs 120,000 |
| Current liabilities | Rs 150,000 |
| Current ratio | 300,000 ÷ 150,000 = 2.00x |
| Quick ratio | (300,000 − 120,000) ÷ 150,000 = 1.20x |
Check the underlying figures
The Underlying figures card shows every amount the ratios were built from:
- Balance sheet — as of the To date: cash, receivables, inventory, current and total assets, payables, debt, equity capital, retained earnings, Result for the period and total equity.
- Income statement for the period: revenue, cost of sales, gross profit, operating expenses, operating income and net income.
Accounts are sorted into these buckets from their group type, code and name in the Chart of Accounts. If a figure looks wrong, check the group and name of the accounts behind it. A bank loan, for example, should sit under liabilities with loan in its name.
When a warning shows
A yellow box headed Balance sheet does not balance means total assets differ from liabilities plus equity in these figures. Leverage and return ratios are then unreliable.
The check counts only this period's result in equity. It assumes every result before From was closed into Retained Earnings. If earlier years are still open, or From is mid-year, the difference equals that earlier result. Compare with the Balance Sheet on the same date: if it balances, close the old years on Financial Years or start From at the beginning of your books.
If the Balance Sheet does not balance either, run the Statement of Cash Flow for the period. It names the vouchers that post unequal sides.
Common questions
What is a good current ratio? Many lenders look for 1.5 to 2. Below 1 means current liabilities exceed current assets. What is normal depends on your trade.
Why is inventory turnover n/a? There is no stock on the To date, or no cost of sales in the period. A service business usually shows n/a here.
Why are revenue and margins blank for a closed year? When the period includes a closed year-end, the closing voucher moves income and expenses to Retained Earnings. Pick a period inside one financial year, or read margins from the Profit & Loss.
Can I compare branches? Yes, if you work at head office. Pick each branch in Branch and click Generate.
Спасибо. Если помощь всё ещё нужна, напишите на info@eloerp.net.