Profit & Loss
Revenue, cost of goods sold, gross profit, expenses and net profit or loss for any period, straight from the posted ledgers.
The Profit & Loss Statement shows what your business earned and spent over a period, and whether it made a profit or a loss. It reads the same posted vouchers as the Trial Balance, so the two always agree.
Before you begin
- Your plan must include the Profit & Loss. If it is missing from the menu, your plan does not have it.
- Your role needs permission to view the Profit & Loss. Your administrator sets this in Users & Roles.
- Your income and expense accounts must sit under income and expense groups in the Chart of Accounts. The report reads the group type, not the account name.
Where to find it
Open Accounting → Reports → Profit & Loss.
Run the report
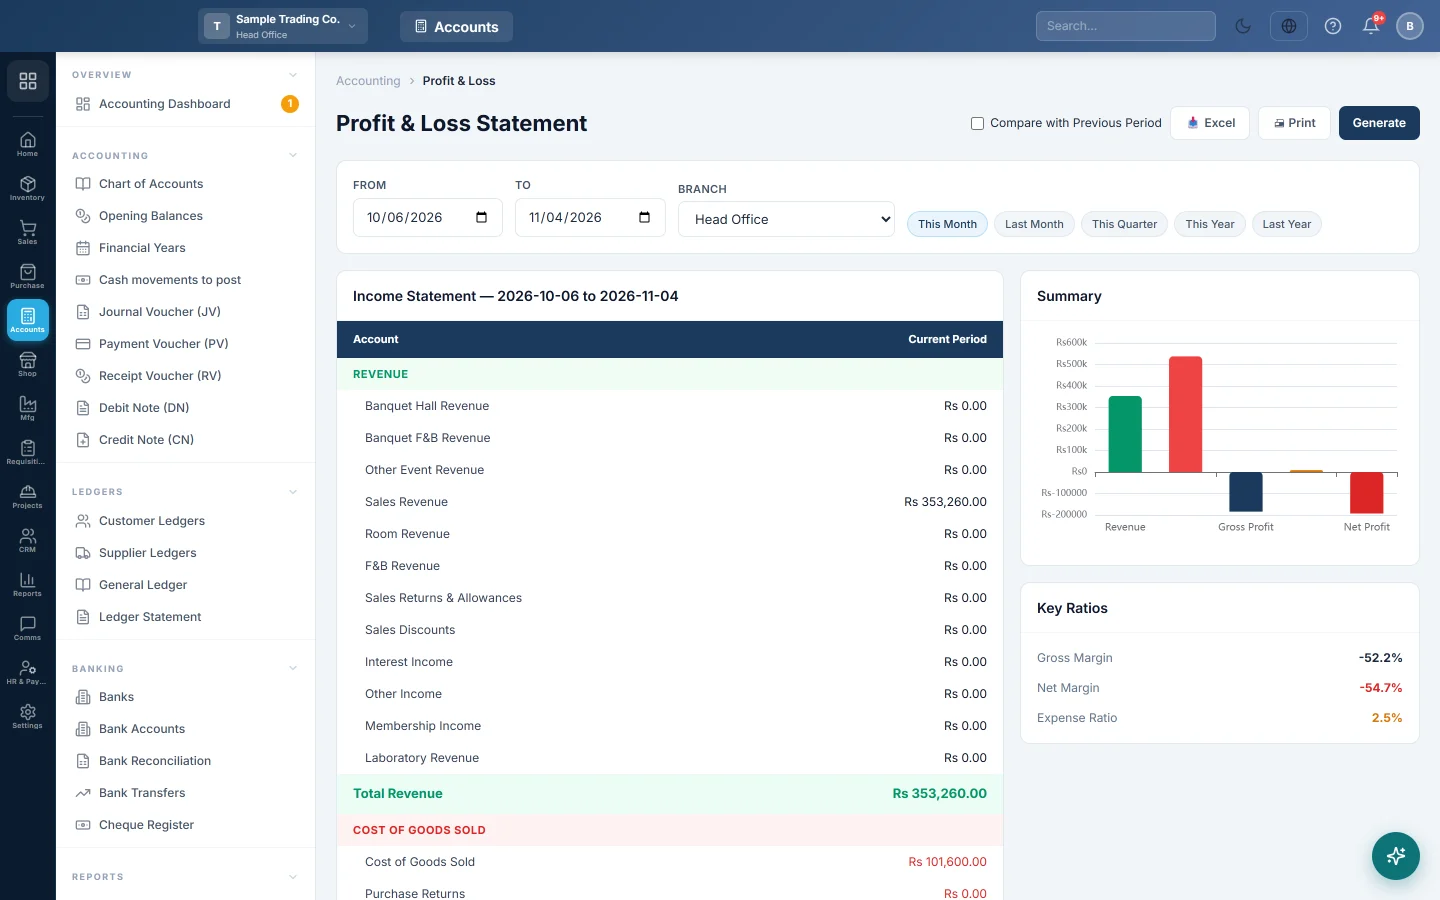
The report loads for the default date range when you open it. The default range is set under Settings → Company → Default Report Date Range.
- Set From and To, or click a quick range: This Month, Last Month, This Quarter, This Year or Last Year. A quick range loads at once.
- If you work at head office, pick a Branch, or All Branches (Consolidated).
- Click Generate.
To see the change from the period before, tick Compare with Previous Period and click Generate. The previous period has the same number of days and ends the day before From. Two columns appear: Previous Period and Change %.
Read the statement
The statement runs from top to bottom:
| Section | What it holds |
|---|---|
| REVENUE | Each income account's credits less its debits for the period. Total Revenue adds them. |
| COST OF GOODS SOLD | The cost of the goods you sold: accounts in the Cost of Goods Sold group, such as purchase returns, discounts and stock adjustments. |
| Gross Profit | Total Revenue less cost of goods sold. |
| OPERATING EXPENSES | Every other expense account: rent, salaries, utilities and so on. Total Expenses adds them. |
| Net Profit / Net Loss | Gross Profit less Total Expenses. The row is green for a profit and red for a loss. |
A worked example for one month:
| Line | Amount |
|---|---|
| Sales | Rs 500,000 |
| Cost of goods sold | Rs 320,000 |
| Gross Profit | Rs 180,000 |
| Rent | Rs 40,000 |
| Salaries | Rs 90,000 |
| Net Profit | Rs 50,000 |
On the right, Summary charts the five totals. Key Ratios shows Gross Margin, Net Margin and Expense Ratio, each as a percentage of Total Revenue.
Print or export
- Click Print for a printed statement with each account under its section and the totals at the end.
- Click Excel to download the same rows as a spreadsheet.
When cost of sales was not fully posted
The report also adds up the cost carried by every sold item in the period. When that cost is more than the cost posted to the ledger, an amber line appears under cost of goods sold. It says how much cost of sales has not been posted.
The usual causes are sales of items with no cost price, or a sale whose stock vouchers failed to post. Check the item costs on the Sale Profit Report.
Common questions
Why is my profit here different from the Sale Profit Report? This statement reads the ledgers, so it includes every expense and every posted cost. The Sale Profit Report works from the invoice lines only. Use this statement for your real profit.
I closed the year. Does the P&L for that year still show the profit? Yes. The closing voucher that moves profit into Retained Earnings is left out of this report, so a closed year still shows its full result.
An expense account is missing from the statement. Only active accounts under an expense group appear. Check the account's group and status in the Chart of Accounts.
Why does the Balance Sheet show a different net profit? The Balance Sheet shows the profit from the start of the financial year to its as-of date. Run this statement for exactly that period and the figures match.
Can I see each branch separately? Head-office users can pick a branch in the Branch box. Other users always see their own branch.
Why do some rows show a dash under Change %? The percentage is worked out for revenue rows, Total Revenue, Gross Profit and the net result. Cost and expense rows show the previous amount without a percentage.
Спасибо. Если помощь всё ещё нужна, напишите на info@eloerp.net.