Sale Profit Report
Profit on what you sold in a period, by item, invoice, customer or category, after returns and invoice discounts and against the cost of the goods.
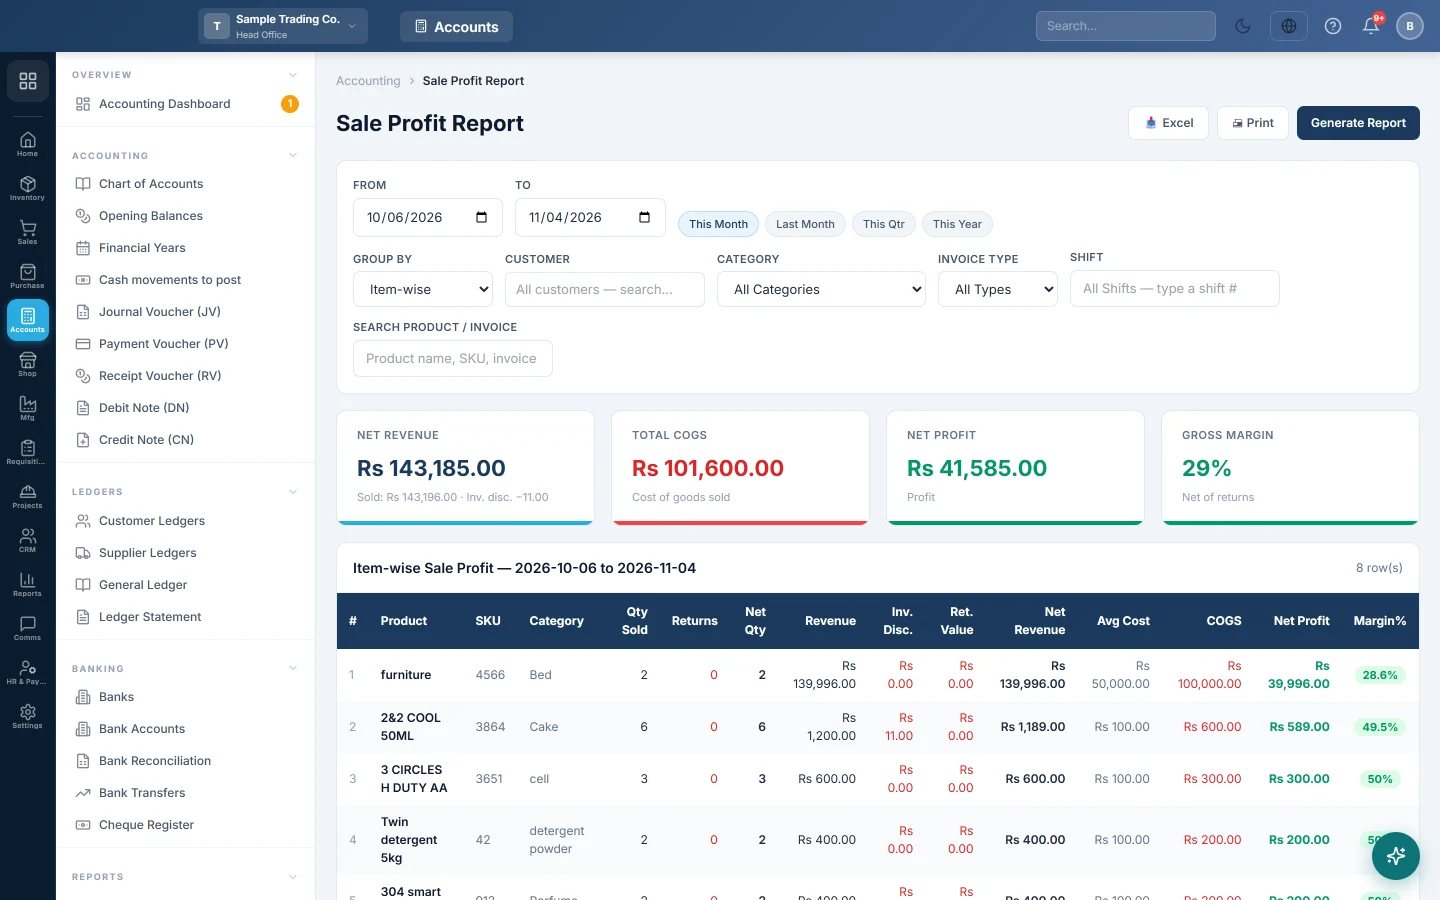
The Sale Profit Report shows how much you made on your sales: what you sold, less returns and discounts, less what the goods cost you. It answers "which items, invoices or customers earn me the most?".
Before you begin
- Your plan must include sale profit analysis. If the report is missing from the menu, see Billing.
- Your role needs permission to view the Sale Profit report. Your administrator sets this in Users & Roles.
- Products need a cost price, from purchases or set on the product. A product sold with no cost shows a 100% margin.
- This is the same report as Sales → Reports → Profitability Report. See Profitability Report.
Where to find it
Open Accounting → Reports → Sale Profit Report.
Run the report
The report loads for the company's default date range when you open it. The default is set under Settings → Company → Default Report Date Range.
- Set From and To, or click This Month, Last Month, This Qtr or This Year.
- In Group By, pick Item-wise, Invoice-wise, Customer-wise or Category-wise.
- Narrow it down if you need to: Customer, Category, Invoice Type (Cash, Credit, Installment), Shift, or Search Product / Invoice.
- Click Generate Report.
The quick-range buttons reload the report at once. After changing any other filter, click Generate Report. Use Excel or Print to keep a copy.
The report covers the branch shown in the top bar.
Read the summary cards
| Card | What it shows |
|---|---|
| Net Revenue | What you sold, less invoice discounts and returns. The small line shows Sold, Inv. disc. and Returns separately. |
| Total COGS | The cost of the goods sold, less the cost of goods that came back. |
| Net Profit | Net Revenue minus Total COGS. Shown in red with the word Loss when it is below zero. |
| Gross Margin | Net Profit as a percentage of Net Revenue, after returns. |
Jewellery shops also see a Making Income card: making, polish and setting charges, which are already inside revenue.
Read the table
Item-wise lists each product (and the variation or unit sold) with Qty Sold, Returns, Net Qty, Revenue, Ret. Value, Net Revenue, Avg Cost, COGS, Net Profit and Margin%. A product marked returned this period, sold earlier came back in this period but was sold before it.
Invoice-wise lists each sale invoice with its Customer, Salesperson, Line Disc. and Tax, newest first.
Customer-wise and Category-wise add up each customer or category, with the number of Invoices or Products.
Rows other than invoice-wise are sorted by profit, highest first. An Inv. Disc. column appears only when some invoice had a discount on the whole invoice; that discount is shared over the invoice lines by value.
The Margin% badge is green at 20% and above, amber from 10% and red below 10%.
A worked example for one item:
| Amount | |
|---|---|
| Revenue: 10 units at Rs 1,200 | Rs 12,000 |
| Less Ret. Value: 1 unit back | Rs 1,200 |
| Net Revenue | Rs 10,800 |
| COGS: 9 units at Rs 900 | Rs 8,100 |
| Net Profit | Rs 2,700 |
| Margin% | 25% |
Why figures can look wrong
- A very high margin. The product had no cost price when it was sold. Enter purchases before selling, or set a cost on the product.
- A loss on an item. It was sold below cost, or its cost price was entered too high.
- Returns in a different period. A return counts in the period of the return, not the period of the sale.
- Different from the Profit & Loss. The P&L also includes expenses, stock adjustments and other income. Services that carry no stock show no cost here.
- Draft and cancelled invoices are left out. Paid, partly paid and unpaid confirmed invoices are all counted.
Common questions
What cost does the report use? The cost recorded on the sale line when the item was sold. When that is missing, it uses the product's cost price.
Why is my restaurant dish showing a cost when it is not a stock item? A made-to-order dish gets its cost from the kitchen work order that made it. A service with no work order has no cost.
Can I see one salesperson's profit? Use Invoice-wise; the Salesperson column shows who made each sale. The Excel file can then be sorted by that column.
I changed Group By and the table shows blanks. The columns change at once, but the figures only reload when you click Generate Report. Click it after every change of Group By.
Can head office see all branches together? No. The report shows the branch in the top bar. Switch branch to see another one.
Thank you. If you still need help, write to info@eloerp.net.