OT Dashboard
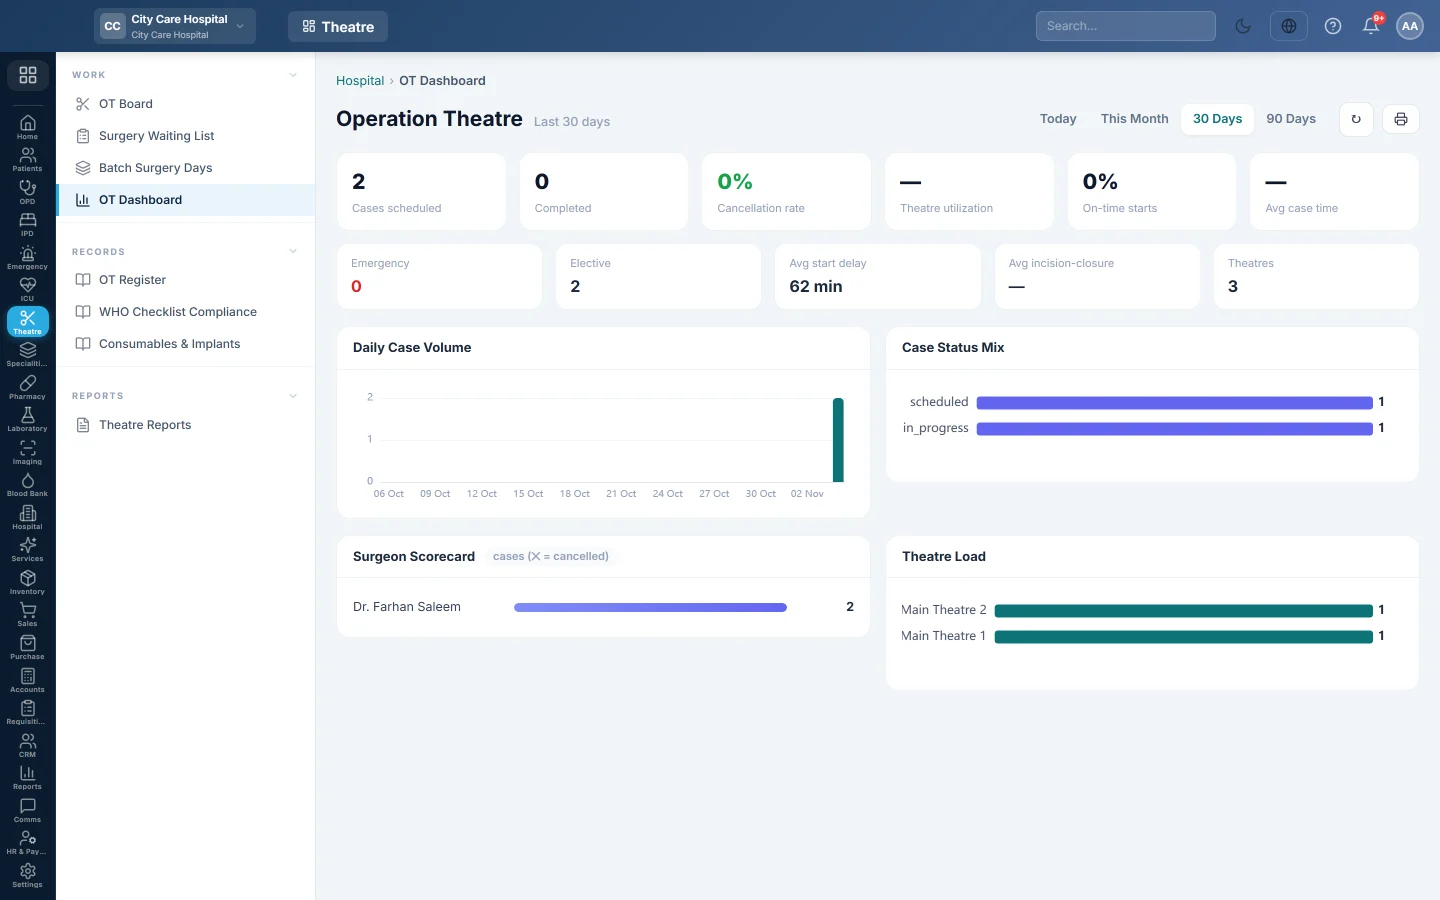
Theatre analytics - cases scheduled and completed, cancellation rate, theatre utilisation, on-time starts and case times, with daily volume, status mix, surgeon scorecard, theatre load and cancellation reasons.
The OT Dashboard shows how well the theatres are used. Managers use it to watch cancellations, late starts and each surgeon's workload.
Before you begin
- Your role needs the clinical dashboards, hospital reports or OT view permission. See Users & Roles.
- Until there are cases, the page says No theatre activity to report yet.
Where to find it
Open Operation theatre → Work → OT Dashboard. The page is titled Operation Theatre.
Read the dashboard
- Pick the period: Today, This Month, 30 Days or 90 Days.
- Read the tiles: Cases scheduled, Completed, Cancellation rate, Theatre utilization, On-time starts, Avg case time, Emergency and Elective counts, Avg start delay, Avg incision-closure and Theatres.
- Read the charts: Daily Case Volume, Case Status Mix, Surgeon Scorecard, Theatre Load and Cancellation Reasons.
Common questions
Utilisation and start times look wrong. They come from the times recorded on each case: patient in, incision and closure. Record them as the case moves on. See Run a surgery case.
Where can I get these as tables? In Theatre Reports, for example OT Utilisation Report and On-Time First-Case Starts.
Merci. Si vous avez encore besoin d’aide, écrivez à info@eloerp.net.