ICU Dashboard
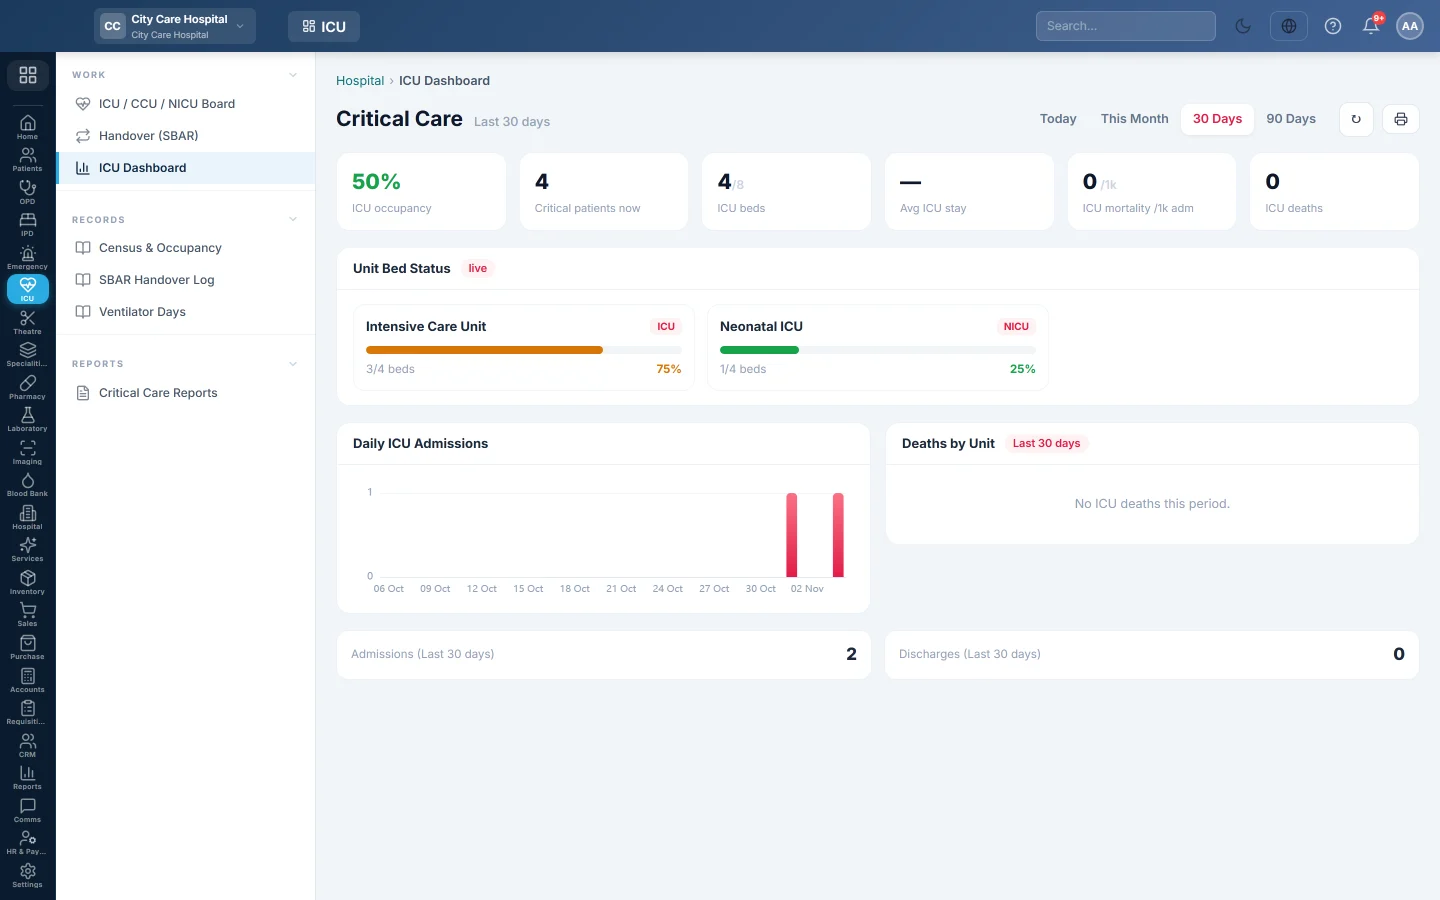
Critical-care analytics - ICU occupancy, critical patients now, ICU beds, average ICU stay and ICU mortality, with live unit bed status and charts of admissions and deaths.
The ICU Dashboard shows how full the critical-care units are and how their patients do. Managers use it to watch occupancy, length of ICU stay and deaths.
Before you begin
- Your role needs the clinical dashboards, hospital reports or critical-care view permission. See Users & Roles.
- ICU, CCU or NICU wards are set up. Until there are any, the page says No ICU/CCU/NICU wards configured, or no activity yet.
Where to find it
Open Intensive care → Work → ICU Dashboard. The page is titled Critical Care.
Read the dashboard
- Pick the period: Today, This Month, 30 Days or 90 Days.
- Read the tiles: ICU occupancy, Critical patients now, ICU beds, Avg ICU stay, ICU mortality /1k adm and ICU deaths.
- Unit Bed Status shows each unit's beds live.
- Read Daily ICU Admissions and Deaths by Unit.
Common questions
Where are ventilator days? Run Ventilator Days in the Reports Library.
What is ICU mortality /1k adm? Deaths in critical-care units for every 1,000 critical-care admissions in the period.
The occupancy differs from the bed board. The dashboard counts ICU, CCU and NICU beds only.
Vielen Dank. Wenn Sie weitere Hilfe brauchen, schreiben Sie an info@eloerp.net.