Stock Levels
How much of each product and variation you hold in every warehouse, what it cost and what the stock is worth, with low-stock and out-of-stock flags.
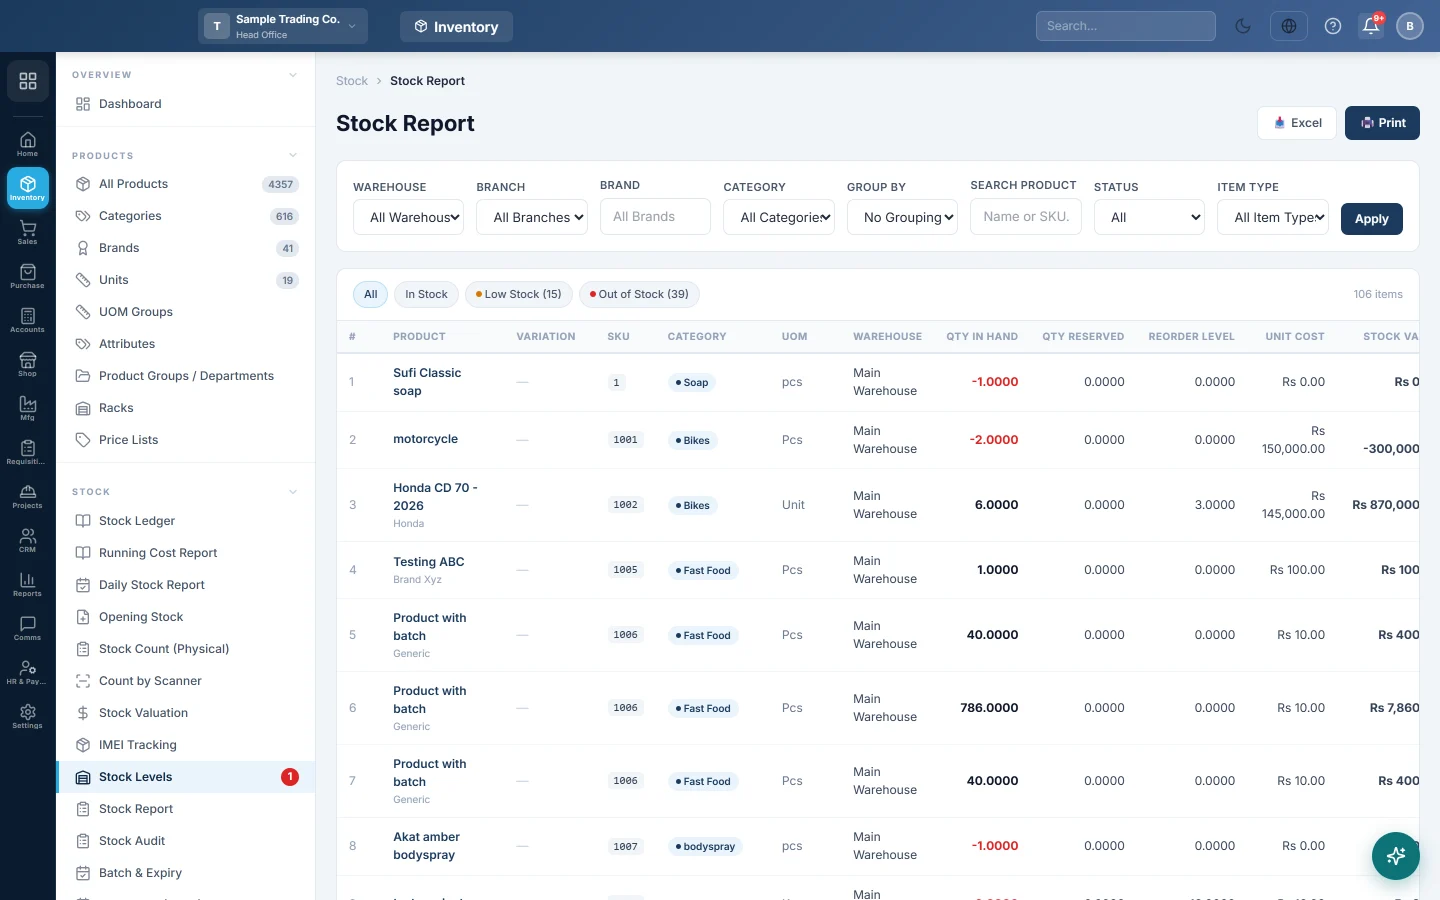
Stock Levels shows the quantity you hold right now for every product, variation and warehouse, with its average cost and stock value. Use it to see what is running low, what is out of stock and how much money sits on your shelves.
Before you begin
- Products must have stock from a purchase, opening stock or adjustment. See All Products.
- Set a Reorder Level on each product (or each variation) so the screen can mark items as Low Stock.
- Your role needs permission to view the stock report.
Where to find it
Open Inventory → Stock → Stock Levels. The page heading reads Stock Report.
Read the report
Each line is one product (or one variation) in one warehouse. A product held in two warehouses has two lines.
| Column | What it shows |
|---|---|
| Product | The product name, with its brand under it. Click the name to open the product in a new tab. |
| Variation | The variation, such as a size or colour. Unassigned means stock sits on a variant product without a variation and needs moving to the right one. |
| SKU | The variation's SKU, or the product's SKU. |
| Category, UOM, Warehouse | The item's category, its unit and where the stock is. |
| Qty in Hand | What you hold now. Red means zero or below; amber means at or below the reorder level. |
| Qty Reserved | Quantity on confirmed or approved sale orders that is not delivered or invoiced yet. |
| Reorder Level | The higher of the warehouse level and the product (or variation) level. |
| Unit Cost | The average purchase cost. |
| Stock Value | Qty in Hand × Unit Cost. |
| Status | In Stock, Low Stock or Out of Stock. |
The Grand Total row and the footer show the total quantity and Total Value of the lines on screen.
Filter the report
- Pick a Warehouse or a Branch. The report reloads at once.
- Pick a Brand or a Category. A parent category includes its sub-categories.
- Type in Search Product to find a product by name or SKU.
- Choose a Status and click Apply.
- If you see Item Type, choose Saleable, Store-Consumable or Fixed-Asset items.
- Use the chips above the table, All, In Stock, Low Stock and Out of Stock, to switch views without reloading.
Group by category or brand
- Choose Category or Brand in Group By.
- Each group gets a heading and a Total row with its quantity and value. Sub-categories sit under their parent.
- Choose No Grouping to go back to a flat list.
Print or export
- Set the filters and grouping you want.
- Click Print for a printable copy, or Excel to download a spreadsheet. Both follow the order on screen.
Common questions
Why does a product not appear? Services and items that do not track stock never appear. A product also needs a stock line, which it gets from its first purchase, opening stock or adjustment.
Why is an item Low Stock when it still has plenty? The reorder level used is the higher of the warehouse level and the product level. Check both on the product.
What is the difference between Stock Levels and Stock Report? They show the same lines. Stock Levels adds Unit Cost and Stock Value; Stock Report leaves the money out.
Why does the value differ from Stock Valuation? This screen values stock at average purchase cost today. Stock Valuation is the report built for valuing stock.
Where do I see how the quantity got here? Open the Stock Ledger for the product and warehouse.
Merci. Si vous avez encore besoin d’aide, écrivez à info@eloerp.net.