Stock Valuation
The value of the stock you hold, grouped by category, warehouse, brand or product, today or as of a past date.
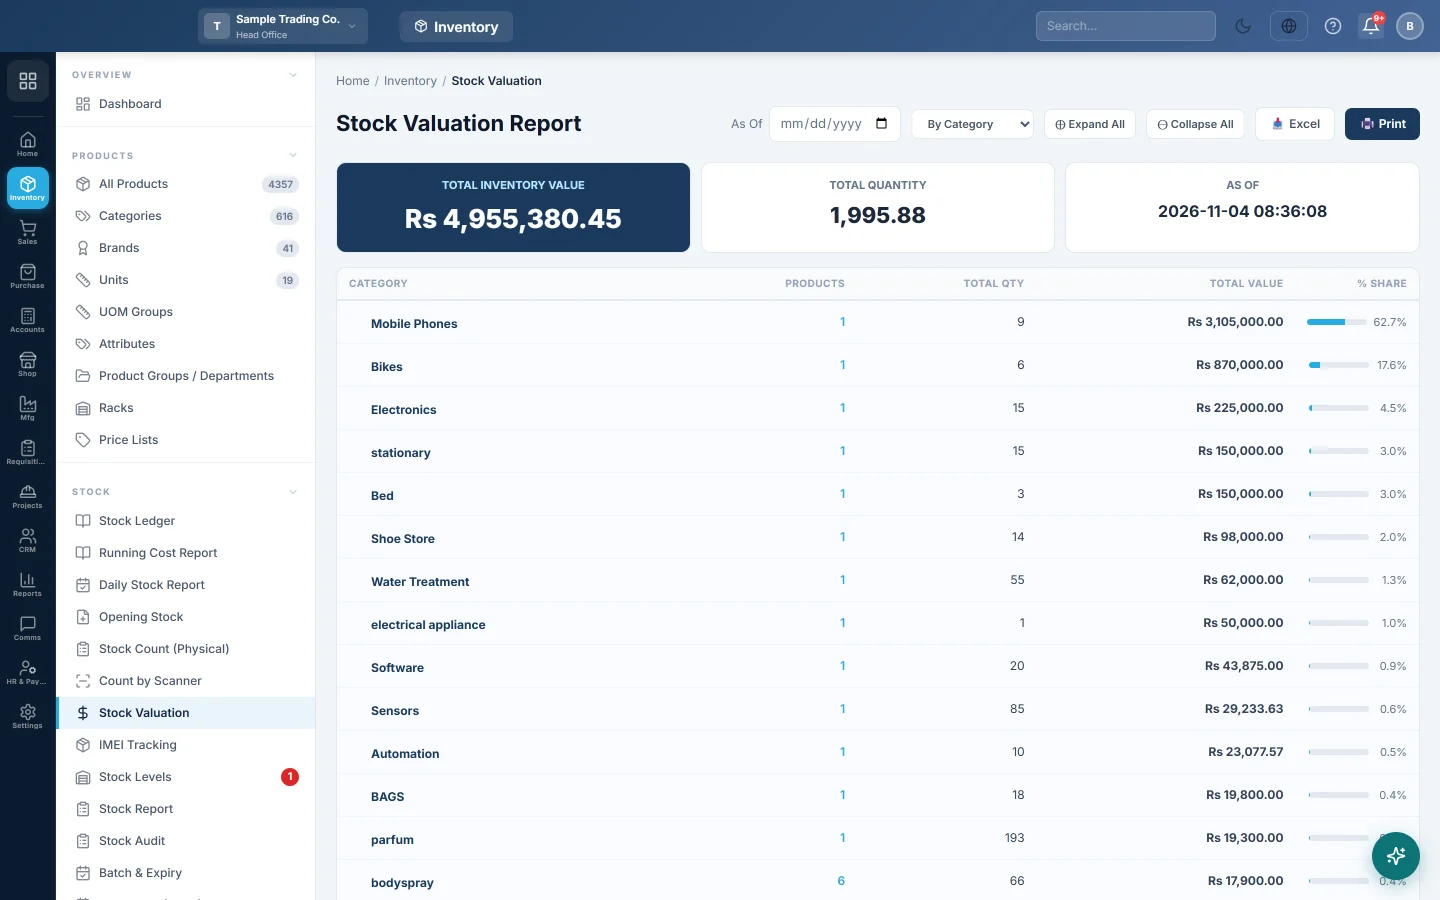
The Stock Valuation Report tells you what your stock is worth. It multiplies the quantity on hand by its average cost and groups the result by category, warehouse, brand or product.
Before you begin
- Stock must be on hand, entered through Opening Stock, purchases or transfers.
- Your role needs the stock valuation permission. See Users & Roles.
- The report covers the branch shown in the top bar. Switch branch to value another branch.
Where to find it
Open Inventory → Stock → Stock Valuation.
Value your stock today
- Open the page. It shows today's stock, grouped By Category.
- Pick another grouping in the list: By Warehouse, By Brand or By Product.
The cards at the top show the Total Inventory Value, the Total Quantity and the As Of time.
Value your stock on a past date
- In As Of, pick a past date.
- The report reloads. A yellow note says it is a historical valuation.
For a past date, quantities and costs are rebuilt from the stock ledger as they stood on that date. Variation rows are not shown in this mode.
Read the report
| Column | Meaning |
|---|---|
| Category, Warehouse, Brand or Product | The group. |
| Products | How many products in the group have stock. Click the number to open the Stock Report for that group in a new tab. |
| SKU | Shown instead of Products when you group by product. |
| Total Qty | Quantity on hand. |
| Avg Cost | Shown when you group by product. |
| Total Value | Quantity × average cost. |
| % Share | The group's part of the total value. |
By Category shows a tree: a parent category includes the value of its sub-categories. Click ▶ or ▼ to open or close a branch, or use ⊕ Expand All and ⊖ Collapse All. Products with no category are listed as Uncategorized.
By Product shows each variation under its product for variant products.
How the value is worked out
- Value = quantity on hand × the weighted-average purchase cost of that product in that warehouse.
- When a product has no average cost yet, its Cost Price from the product is used.
- Only positive stock is valued. Products at zero or below zero are left out.
- Services and non-stock items are left out.
The Running Cost Report shows how one product's average cost was built up.
What happens in the books
Nothing is posted. This report reads your stock records, not your accounts.
Your accounts hold their own inventory figure, in the stock account of your Chart of Accounts. Compare the two on the Trial Balance at month end. A difference points to stock movements whose accounting entry is missing or different, so investigate it before you close the period.
Export or print
- 📥 Excel saves the table.
- 🖨️ Print prints it with the grouping and date.
Common questions
Why does a product show a value with no purchases? It has opening stock, or its Cost Price is used because it has no average cost yet.
Why is my stock value lower than expected? Products with negative stock are not counted. Find them on Stock Levels and correct them with a count or an adjustment.
Can I value stock at the sale price? No. The report values stock at cost.
Why does the as-of value for yesterday differ from today's? Stock moved since then, and each purchase can change the average cost.
Does it cover all branches? No, only the branch in the top bar. Run it in each branch.
Merci. Si vous avez encore besoin d’aide, écrivez à info@eloerp.net.