Inventory Reports
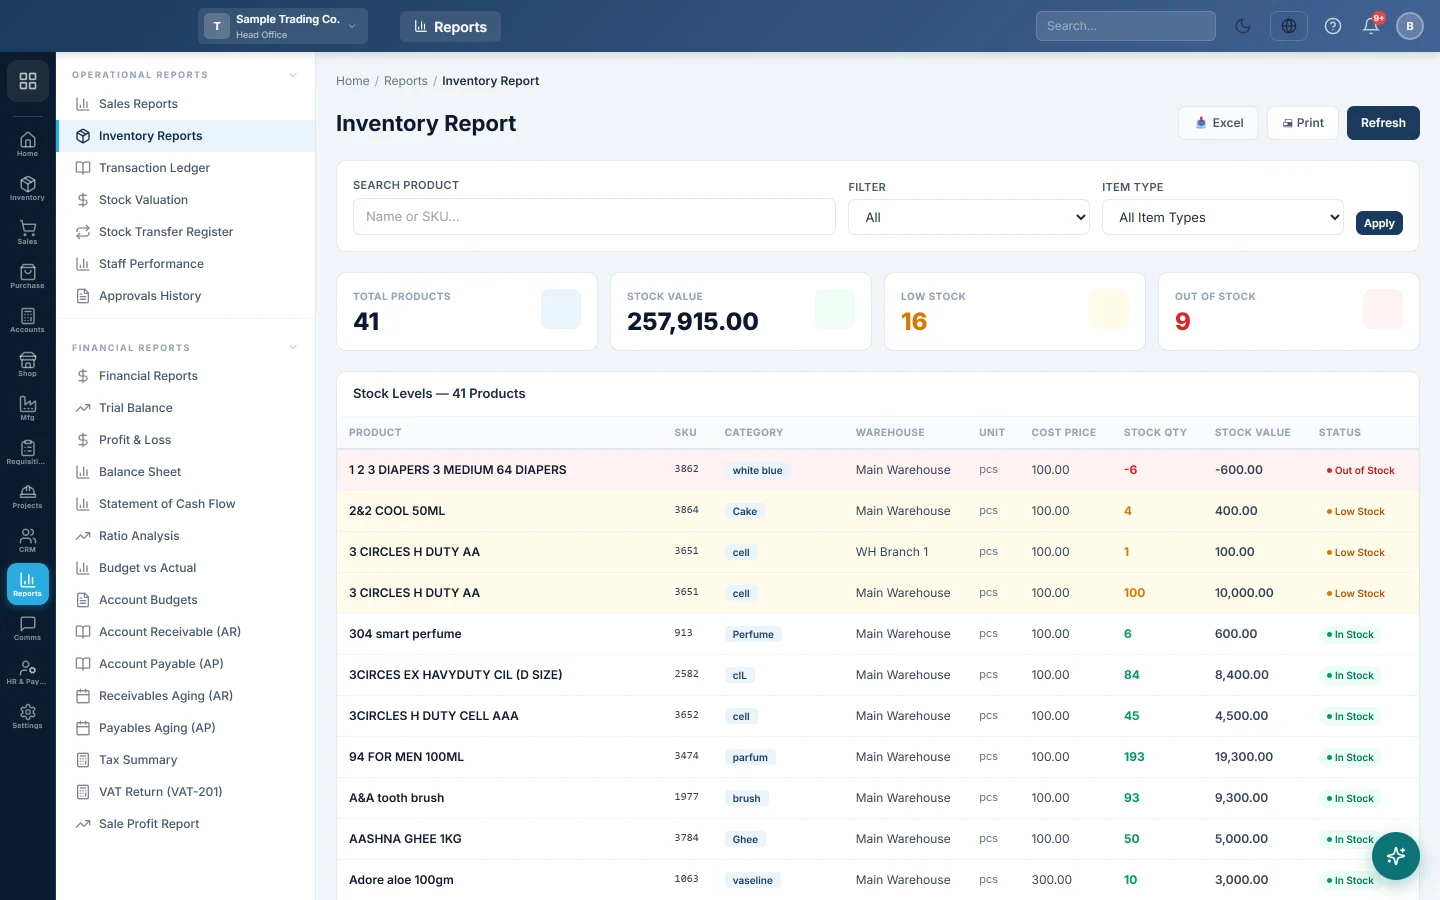
A quick list of the stock you hold right now, with quantity, cost and value per line, and counts of low and out-of-stock items.
The Inventory Report lists the stock you hold today, what it cost and what it is worth. Use it for a quick look at stock on hand and at what has run out; it always shows the current position, not a past date.
Before you begin
- Stock comes from purchases, opening stock, stock adjustments and stock transfers.
- Your role needs View Inventory Reports (Top-level) under Settings → Users & Roles.
- The Item Type filter appears only if your role may see internal items (store consumables and fixed assets). Without it you see saleable items only.
Where to find it
Open Reports → Operational Reports → Inventory Reports.
Run the report
- Type a product name or SKU in Search Product, or leave it empty for everything.
- Choose Filter: All, Low Stock or Out of Stock.
- Choose an Item Type if the box is shown.
- Click Apply.
Click Refresh at the top to reload the figures after new sales or purchases.
Read the table
The table lists one line for each product in each warehouse it is stocked in. A product kept in two warehouses appears twice.
| Column | What it means |
|---|---|
| Product, SKU, Category | From the product record. |
| Unit | Shown for products weighed in jewellery units; blank for others. |
| Cost Price | The average purchase cost of the stock in that warehouse. If there is none yet, the product's own cost price. |
| Stock Qty | Quantity on hand now. Negative means more was sold than was recorded in. |
| Stock Value | Stock Qty × Cost Price. |
| Status | Out of Stock at zero or less, Low Stock from 1 to 5, In Stock above 5. |
Red rows are out of stock and amber rows are low. Click the Product, Cost Price, Stock Qty or Stock Value heading to sort; click again to reverse. Total Stock Value at the bottom adds up the lines shown.
Read the totals
- Total Products: the number of lines in the table (product and warehouse pairs).
- Stock Value: the value of all lines.
- Low Stock and Out of Stock: how many lines are in each state.
The cards do not change when you pick Low Stock or Out of Stock in Filter; they always show the whole list.
Print or export
Click Print or Excel. The output is dated As on today and lists the filters you used.
Common questions
A product shows as Low Stock but it is above its reorder level. This report treats 1 to 5 units as low for every product. For each product's own reorder level, use the Min Stock Level report.
The same product appears more than once. It is held in more than one warehouse. Use Stock Levels to see the warehouse of each line and the total per product.
The value differs from the Stock Valuation report. Stock Valuation is worked out from the stock ledger and leaves out lines at zero or below. This list reads the current balances and counts negative stock as negative value. Fix negative stock with a stock adjustment.
I need the stock on a past date. This report shows today only. Use the Stock Ledger or the Daily Stock Report.
Head office sees more stock than the branch. At head office the report covers every warehouse in the company. In other branches it covers that branch's warehouses only.
Спасибо. Если помощь всё ещё нужна, напишите на info@eloerp.net.