KPI Cockpit
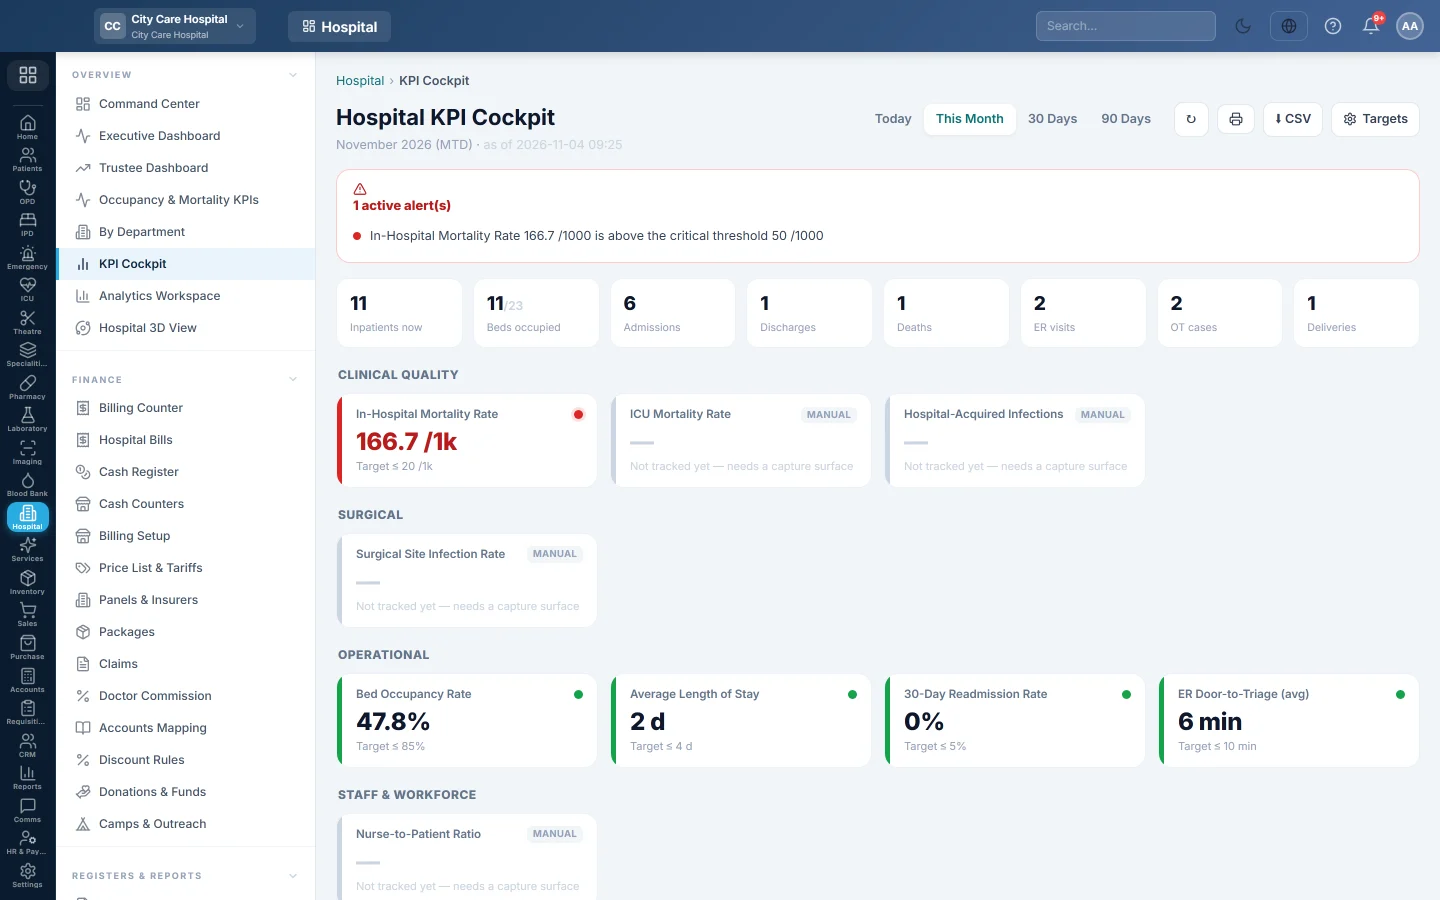
The hospital's key indicators against their targets, with red, amber and green status, alerts, admissions against discharges and a mortality breakdown. Managers set the targets here.
The KPI Cockpit shows each hospital indicator with its target and a red, amber or green status, and lists the ones out of range as alerts. Managers set the targets and thresholds from the same screen.
Before you begin
- Viewing needs the cockpit view or HIMS reports view right. Targets shows only for managers.
- The numbers come from daily work: admissions, discharges, deaths, ER visits, theatre cases and bills.
Where to find it
Open Hospital → Overview → KPI Cockpit. It is also the first tab of the Analytics Workspace.
Read the cockpit
- Pick the period: Today, This Month, 30 Days or 90 Days.
- Read the alert line: how many KPIs are out of range, or that all monitored KPIs are within target.
- Read the KPI tiles, each with its value, target and status colour.
- Check the census row: Inpatients now, Beds occupied, Admissions, Discharges, Deaths, ER visits, OT cases and Deliveries.
- Read Admissions vs Discharges for the last 30 days, and the Mortality Breakdown by place of death and by timing.
Click Refresh to update, Print (A4) to print and Export CSV to download.
Set the targets
- Click Targets.
- For each KPI, set the Target, the Warn level and the Critical level.
- Untick On to stop monitoring a KPI.
- Click Save Targets.
The status colour and the alerts follow these levels.
Common questions
The cockpit says no benchmarked KPIs have data. Nothing was recorded for the period yet. Try 90 Days.
Where is a printable monthly version? On KPI Performance, which also compares with the prior period.
Can I change which way is better for a KPI? No. Each KPI already knows whether lower or higher is better. You set only the levels.
Teşekkür ederiz. Hâlâ yardıma ihtiyacınız varsa info@eloerp.net adresine yazın.