ER Dashboard
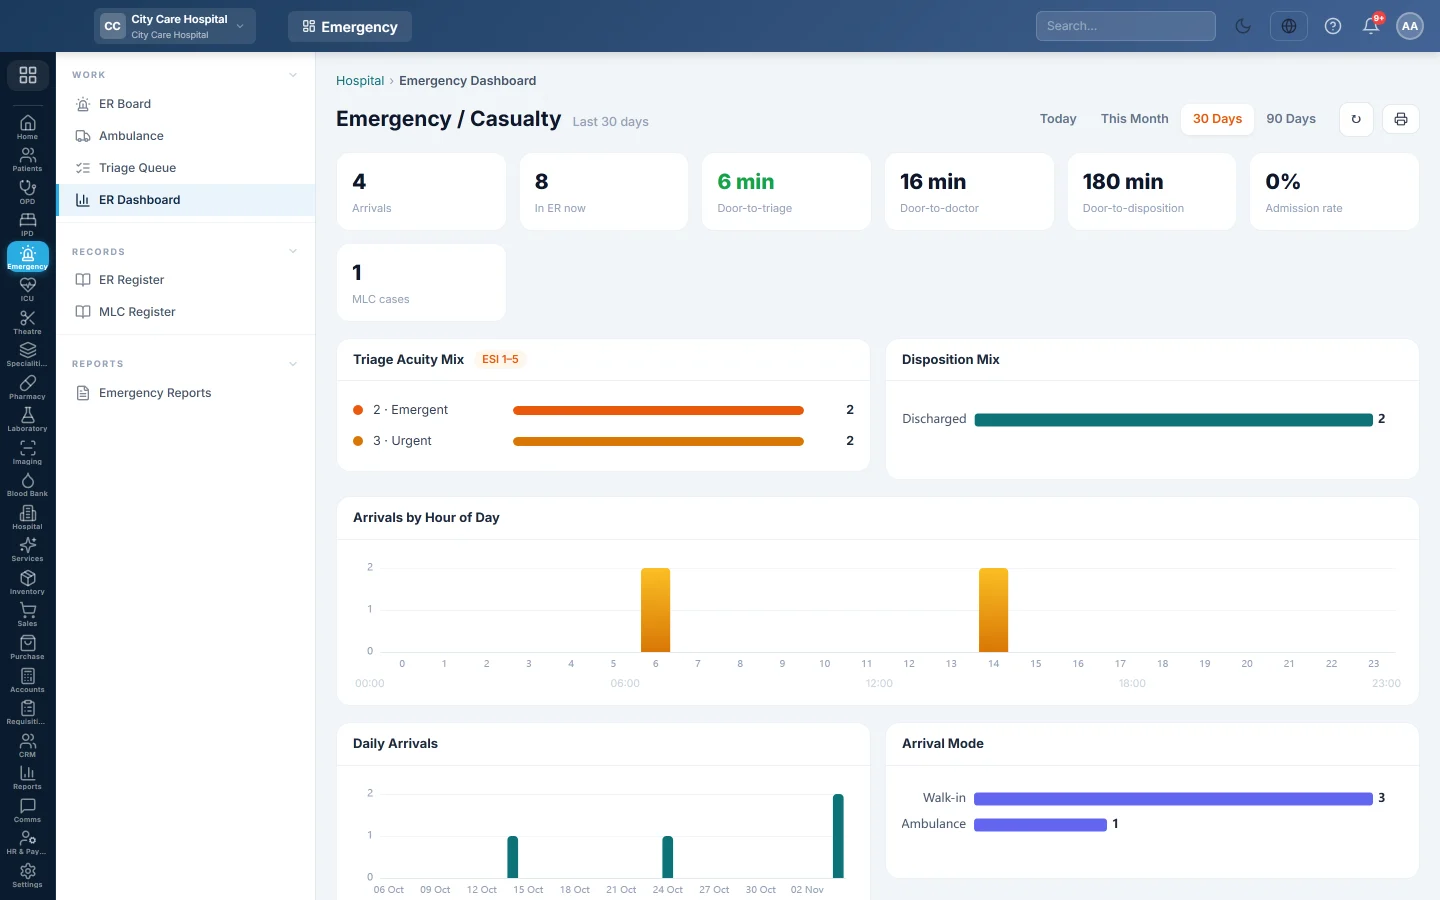
Emergency analytics - arrivals, patients in the ER now, door-to-triage, door-to-doctor and door-to-disposition times, admission rate and MLC cases, with acuity, disposition and arrival charts.
The ER Dashboard shows how busy the emergency is and how fast patients are seen. Managers use it to watch waiting times and plan staff for the busy hours.
Before you begin
- Your role needs the clinical dashboards, hospital reports or emergency view permission. See Users & Roles.
- Until there are visits, the page says No emergency activity to report yet.
Where to find it
Open Emergency → Work → ER Dashboard. The page is titled Emergency / Casualty.
Read the dashboard
- Pick the period at the top.
- Read the tiles: Arrivals, In ER now, Door-to-triage, Door-to-doctor, Door-to-disposition, Admission rate and MLC cases.
- Read the charts: Triage Acuity Mix (ESI 1–5), Disposition Mix, Arrivals by Hour of Day, Daily Arrivals and Arrival Mode.
Common questions
What is door-to-doctor? The minutes from the patient's arrival to the first doctor's assessment.
The times look too long. Visits left open for days stretch the averages. Close old visits with a disposition on the ER Board.
Where can I get these as tables? In Emergency Reports, for example Door-to-Doctor / Wait-Time and ER Peak-Hour / Surge Analysis.
Obrigado. Se ainda precisar de ajuda, escreva para info@eloerp.net.