IPD Dashboard
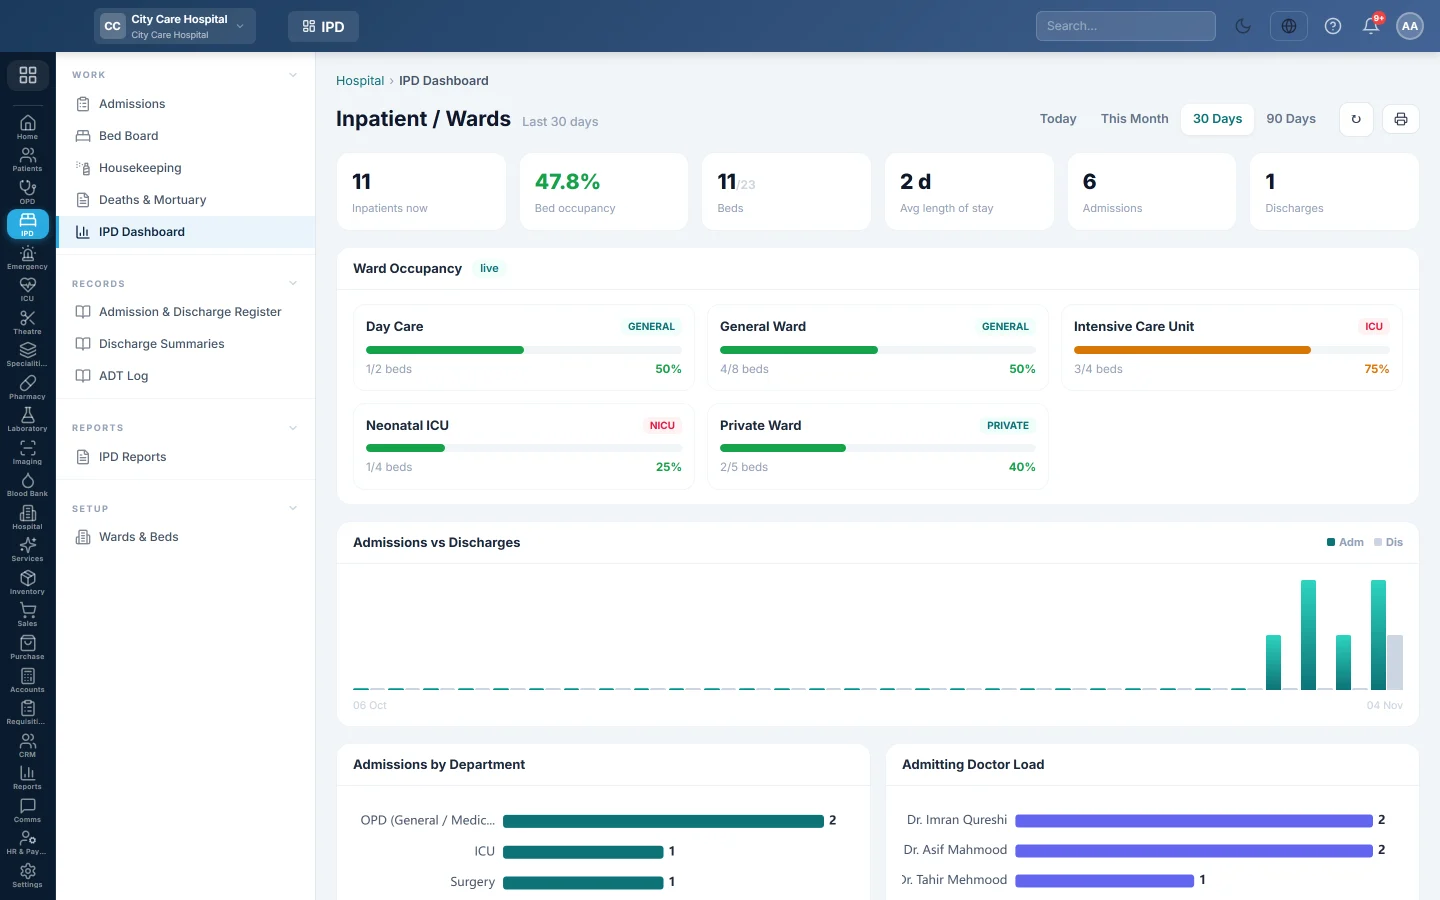
Inpatient analytics - patients in the wards now, bed occupancy, average length of stay, admissions and discharges, with ward occupancy and charts by department, doctor, type and outcome.
The IPD Dashboard shows how full the wards are and how patients move through them. Managers use it to watch occupancy, length of stay and discharge outcomes.
Before you begin
- Your role needs the clinical dashboards, hospital reports or admissions view permission. See Users & Roles.
- Until there are admissions, the page says No inpatient activity to report yet.
Where to find it
Open Inpatients (IPD) → Work → IPD Dashboard. The page is titled Inpatient / Wards.
Read the dashboard
- Pick the period at the top.
- Read the tiles: Inpatients now, Bed occupancy, Beds, Avg length of stay, Admissions and Discharges.
- Ward Occupancy shows each ward's occupied beds live.
- Read the charts: Admissions vs Discharges, Admissions by Department, Admitting Doctor Load, Admission Type and Discharge Outcome.
Common questions
Bed occupancy differs from the Admissions page. Both count beds occupied now. Inactive or blocked beds are not counted as available.
What counts in Avg length of stay? Patients discharged in the period, from admission to discharge.
Where can I get these as tables? In IPD Reports, for example Bed Occupancy Rate and Average Length of Stay (ALOS).
Obrigado. Se ainda precisar de ajuda, escreva para info@eloerp.net.