Dashboard
See revenue, cost, commitments and margin across all your projects, with billing, retention held and the costliest projects.
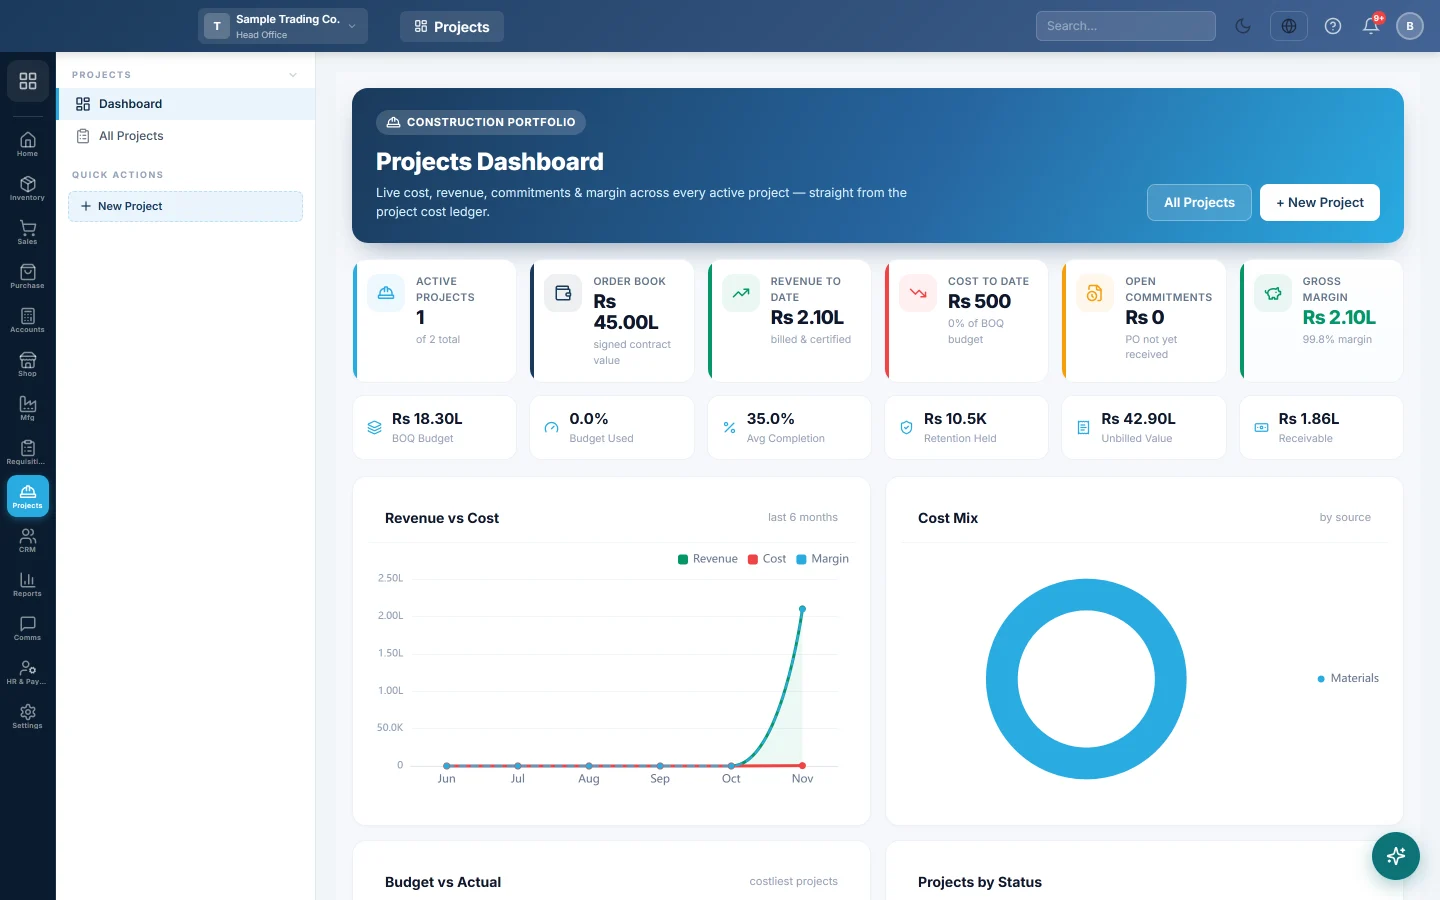
The Projects dashboard shows your whole portfolio at once: what each project has earned and cost so far, what is committed, the margin, and what clients still owe.
Before you begin
- The Projects module must be on for your company. If Projects is not in the module rail, ask your provider to switch it on.
- The figures come from documents tagged with a project: purchases, sale invoices, vouchers and the project's own bills. See All Projects.
Where to find it
Open Projects → Projects → Dashboard. It is also under Home → Module Dashboards → Projects Dashboard.
Read the dashboard
- Revenue vs Cost compares income and cost per month for the last six months.
- Cost Mix splits cost by source, such as materials, subcontractors and expenses.
- Budget vs Actual shows the costliest projects against their BOQ budget.
- Projects by Status counts projects from planning to closed.
- Client Billing & Cash shows Retention Held by clients and the Outstanding amount billed but not paid.
- Top Projects by Cost lists each project's Status, % Done, Contract, Revenue, Cost and Margin. Click a row to open the project.
All Projects opens the list and New Project starts a project.
Common questions
A chart says No ledger movements yet. No document has been tagged to a project yet. Pick the project on a purchase, voucher or invoice, in its Project field.
Budget vs Actual is empty. Budgets come from each project's BOQ. Add BOQ items on the project's BOQ tab.
The figures look out of date. Open the project, go to Settings and click Recompute under Recompute Cost Ledger.
شكرًا لك. إذا كنت لا تزال بحاجة إلى مساعدة، راسلنا على info@eloerp.net.