Accounting Dashboard
A one-page view of revenue, expenses, profit, cash and bank, receivables, payables, tax and cheques for owners and accountants.
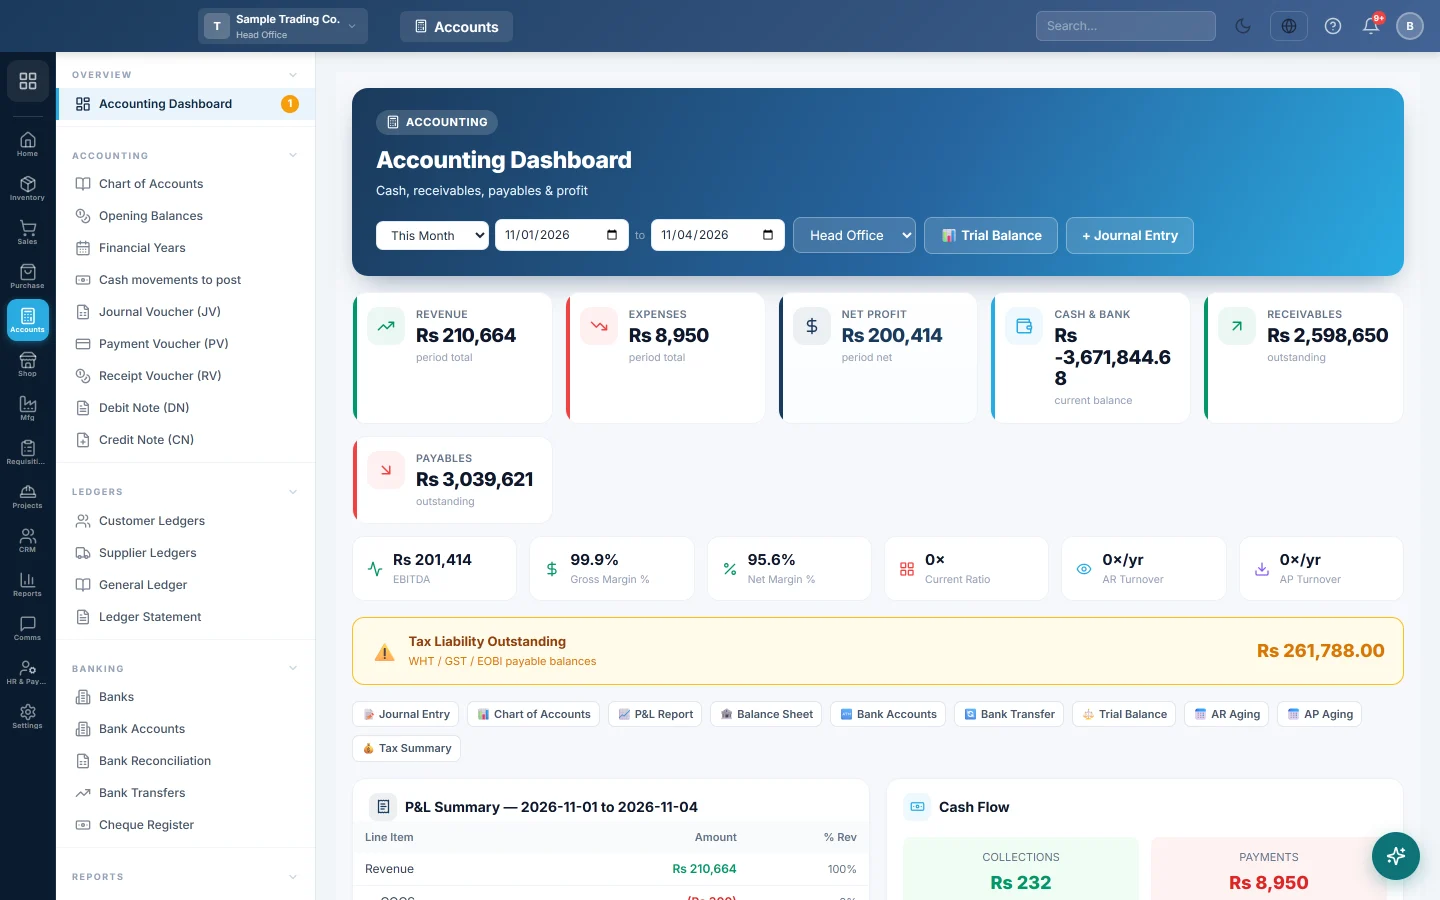
The Accounting Dashboard is the first page of the Accounting module. It shows how the business is doing for a period you pick: what came in, what went out, what you hold in cash and bank, and who owes whom.
Before you begin
- Your role needs access to the accounting dashboard. Ask your administrator to grant it under Users & Roles.
- The figures come from posted vouchers. Sales, purchases, payments and journal vouchers appear here once they are saved.
- The branch selector appears only for users who may see more than one branch, such as head office administrators. See Branches.
Where to find it
Open Accounting → Overview → Accounting Dashboard.
Pick the period and branch
- Use the date range at the top right to choose the period. The page opens on the current month.
- If you see a branch list, pick one branch, or All Branches for the whole company.
- The cards and panels reload on their own.
Read the top cards
| Card | What it shows |
|---|---|
| Revenue | Income posted in the period. Under it, the change against the same period last year. |
| Expenses | Expenses posted in the period, not counting cost of goods sold. |
| Net Profit | Revenue less expenses for the period. |
| Cash & Bank | Today's balance of cash in hand, petty cash and your bank accounts. An overdrawn bank shows as a minus. |
| Receivables | What customers owe you today. |
| Payables | What you owe suppliers today. |
The second row gives quick ratios for the period: EBITDA, Gross Margin %, Net Margin %, Current Ratio, AR Turnover and AP Turnover.
When tax you collected or withheld is still unpaid, an amber Tax Liability Outstanding bar shows the total of your WHT, GST and EOBI payable balances.
Use the panels
- P&L Summary: revenue, cost of goods sold, gross profit, expenses, EBIT, depreciation, EBITDA, interest and net profit, each with its share of revenue (% Rev).
- Cash Flow: COLLECTIONS (receipt vouchers) and PAYMENTS (payment vouchers) in the period, and the Net Cash Flow between them.
- Top Expense Accounts: where most of the money went.
- Tax Payable Summary: tax collected on sales in the period, per tax.
- Pending Bank Reconciliations: bank accounts with entries not yet matched to the statement. Click Open to reconcile them.
- Cheques: with the Cheque Register in use, overdue cheques, cheques due soon and all open cheques. Otherwise Upcoming Cheque Clearing — Next 7 Days.
- Bank Account Balances, Recent Vouchers, P&L Trend (last 6 months) and Balance Sheet Overview.
The row of buttons under the cards opens the screens you need most: Journal Entry, Chart of Accounts, P&L Report, Balance Sheet, Bank Accounts, Bank Transfer, Trial Balance, AR Aging, AP Aging and Tax Summary.
Common questions
The net profit on the dashboard does not match the Profit & Loss report. The top cards and the P&L Summary panel are worked out in slightly different ways, for example in how cost of goods sold is counted. The Profit & Loss report is the figure to rely on.
Cash & Bank, Receivables and Payables did not change when I changed the dates. These three are today's balances, not the period's movement. To see a balance on an earlier date, use the Balance Sheet.
Why is Cash & Bank negative? At least one bank or cash account is overdrawn in the books. Open Bank Accounts or the Ledger Statement of that account to see which entries caused it.
I cannot see the branch list. Only users who may see more than one branch get it. Everyone else sees their own branch.
A sale I just made is not on the dashboard. Check the period at the top and the branch. Draft and cancelled documents post nothing, so they do not count.
Terima kasih. Jika masih butuh bantuan, kirim email ke info@eloerp.net.