Daily Stock Report
A day-by-day grid of stock in and out for many products at once, with the opening, totals and available stock for the period.
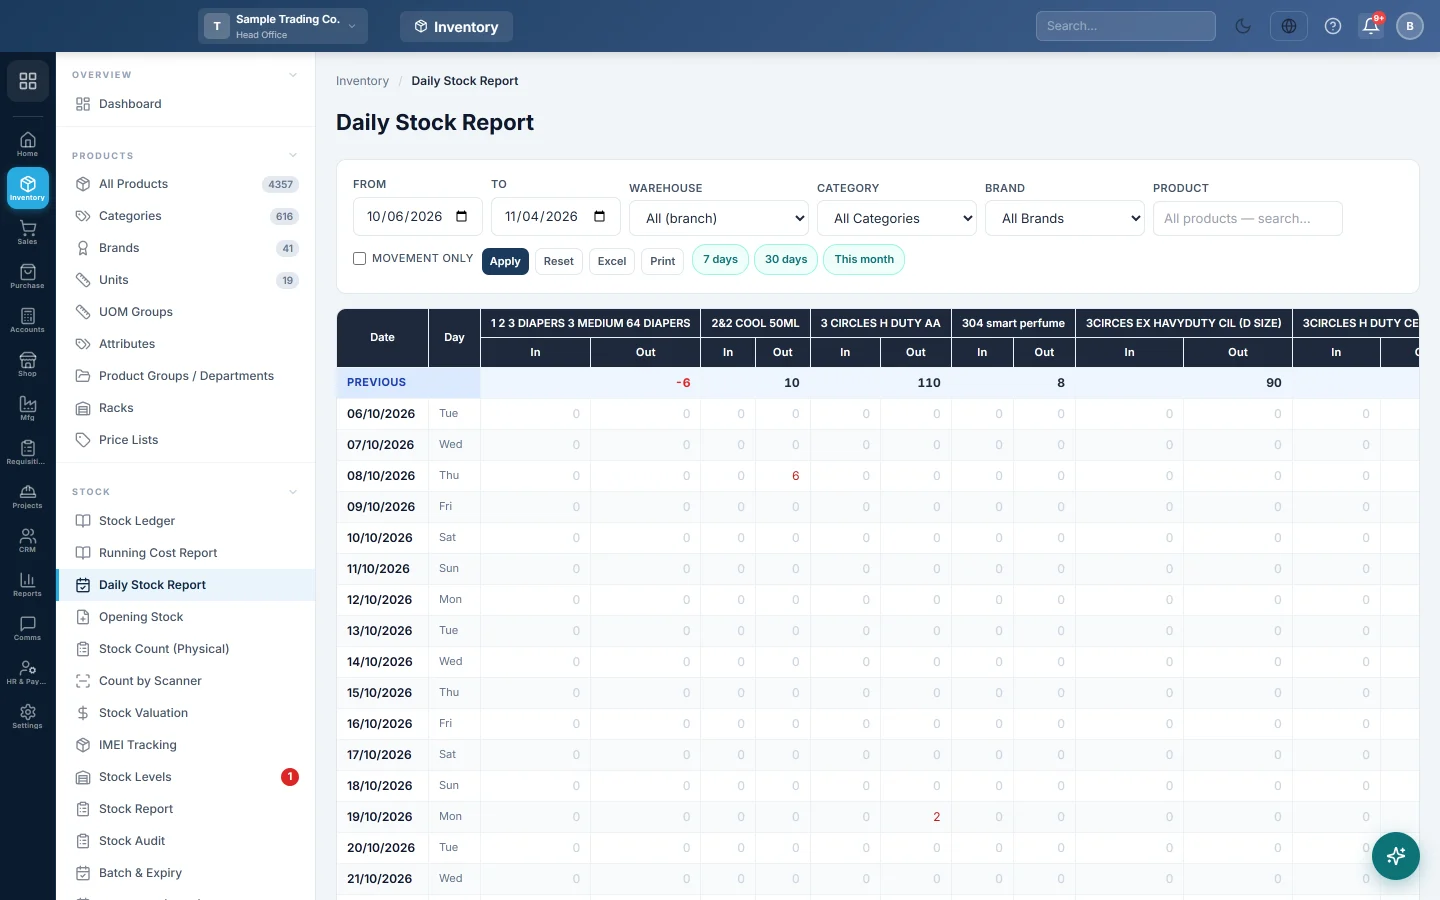
The Daily Stock Report shows, for each day in a period, how much of each product came in and went out. Products are columns and days are rows, so you can follow many items side by side.
Before you begin
- Products need stock movements, such as Opening Stock, purchases or sales.
- Only stock-tracked products appear. Services and non-stock items are left out.
Where to find it
Open Inventory → Stock → Daily Stock Report.
Run the report
- Set From and To. They start on your company's default report period. Or click 7 days, 30 days or This month.
- Optional: pick a Warehouse. All (branch) covers every warehouse of your branch that you may see.
- Optional: narrow the columns with Category, Brand or Product. A category includes its sub-categories.
- Optional: tick Movement only to show only products that moved in the period.
- Click Apply. Reset puts every filter back to its starting value.
Read the grid
| Row | Meaning |
|---|---|
| Previous | Stock of each product before the From date. |
| One row per day | In and Out for that day, with the day of the week. |
| Total | All In and all Out for the period. |
| Available | Previous + Total In − Total Out. |
A negative figure shows in red. It means more stock went out than was recorded coming in.
Without Movement only, the grid also lists products that did not move but still have stock.
Limits on large reports
- The grid shows at most 120 products. When there are more, a yellow note says how many are shown, and the most active products are kept. Filter by category, brand or product to see the rest.
- The period can be at most 400 days. A longer range is cut to 400 days and a note shows the dates used.
Export or print
- Excel saves the grid, with one In and one Out column per product.
- Print prints it in landscape.
Common questions
What counts as In and Out? Every stock movement: purchases, sales, returns, transfers, adjustments, counts and opening stock. The Stock Ledger shows each movement for one product.
Why is a product missing? It had no stock and no movement in the period, or it is a service. It may also be beyond the 120-product limit; filter to find it.
Can I see the value, not only the quantity? No, this report shows quantities. Use Stock Valuation for value.
Why does Available differ from today's stock? Available is the stock at the end of the To date. Movements after that date are not counted.
Спасибо. Если помощь всё ещё нужна, напишите на info@eloerp.net.