Running Cost Report
One product's stock movements with the weighted-average cost and stock value after each one, so you can see how its cost was built up.
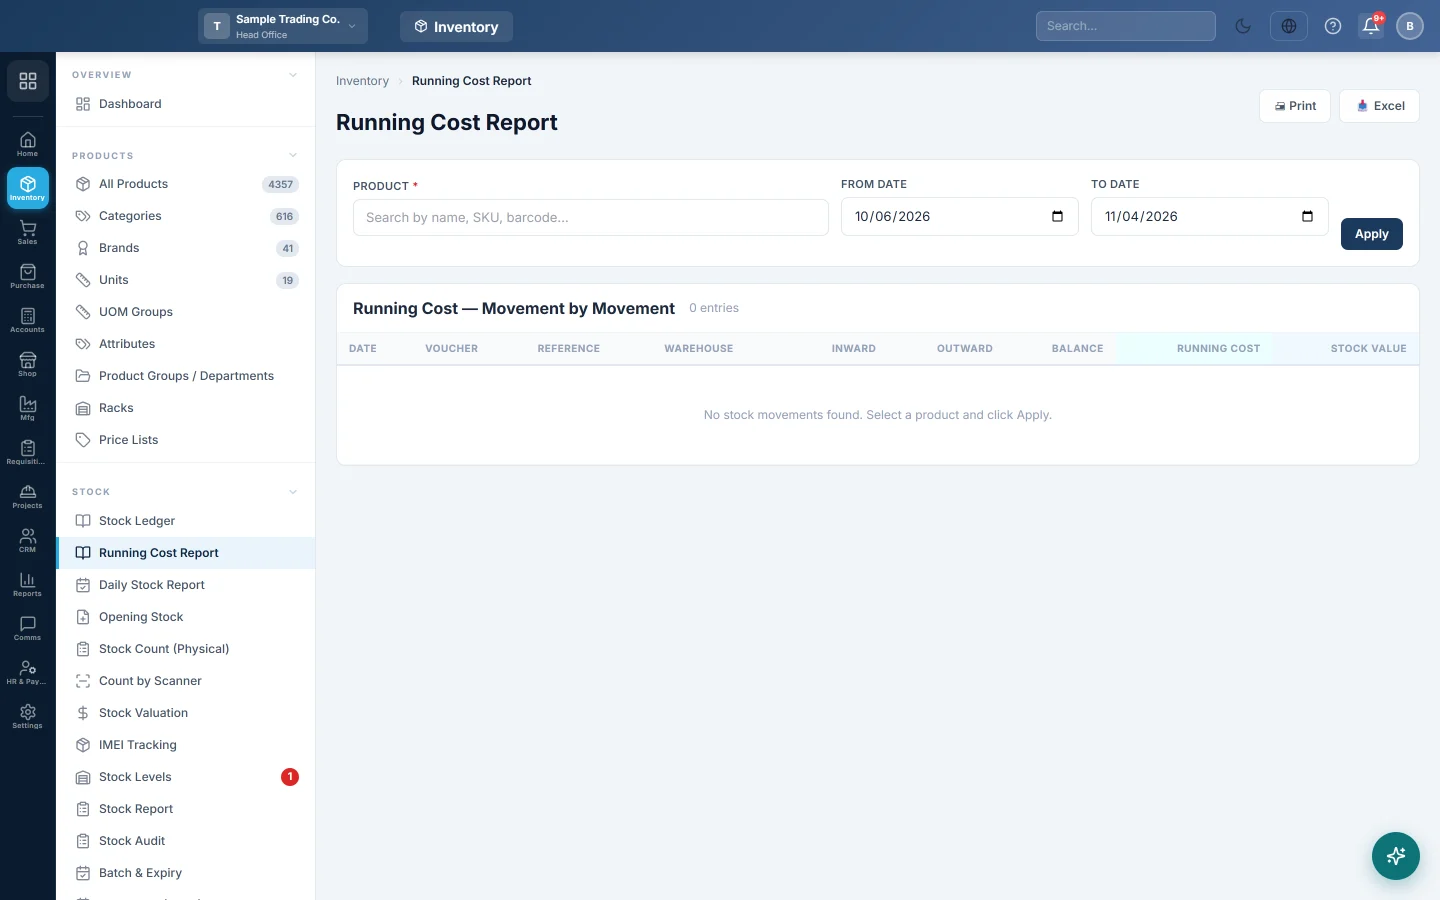
The Running Cost Report shows how a product's cost changes over time. It lists the same movements as the stock ledger and adds the average cost and the stock value after each one.
Before you begin
- The product must have stock movements, such as Opening Stock or a purchase invoice.
- Your role needs the stock ledger permission. See Users & Roles.
Where to find it
Open Inventory → Stock → Running Cost Report.
Run the report
- In Product, type at least two letters of the name, SKU or barcode.
- Pick the product from the list. The report loads at once.
- Change From Date and To Date if needed. They start on your company's default report period.
- Click Apply.
The report covers all the warehouses you are allowed to see. It has no warehouse filter.
Read the report
The cards at the top:
| Card | Meaning |
|---|---|
| Opening Qty | Stock before the From Date, with its value. |
| Closing Qty | Stock at the To Date, with its value. |
| Current Avg Cost | The average cost per unit at the To Date. |
| Stock Valuation | Closing quantity × average cost. |
The table adds two columns to the usual ledger columns:
- Running Cost: the average cost per unit after this movement.
- Stock Value: the balance quantity × the running cost.
How the average cost is worked out
The report replays every movement of the product from its very first one, so the opening cost is correct even for a short period.
- Purchases, opening stock, GRNs, transfers in and stock adjustments bring stock in at the rate on that document. The average is recalculated: (old value + new value) ÷ new quantity.
- Sales, transfers out and other stock going out leave at the current average. They lower the quantity and the value, but not the average.
- Sale returns and other stock coming back come in at the current average. A sale's rate is the selling price, so it never changes the cost.
- When the stock reaches zero, the value resets to zero and the last average is kept.
For example, you hold 10 units at Rs. 100. You buy 10 more at Rs. 120. The average becomes Rs. 110. You then sell 5: the average stays Rs. 110 and the value drops to Rs. 1,650.
Export or print
- 📥 Excel saves the rows to an .xlsx file.
- 🖨 Print prints the page.
Common questions
Why does the average cost not change when I sell? Stock going out leaves at the current average, so the average stays the same. Only cost-bearing stock coming in changes it.
Why is the average different in each warehouse? This report pools all your visible warehouses into one average. Stock Valuation and transfers use the cost held in each warehouse.
A purchase at a wrong rate spoiled the average. How do I fix it? Correct the rate on the purchase invoice. The report is replayed every time you run it, so it shows the new figures at once.
Vielen Dank. Wenn Sie weitere Hilfe brauchen, schreiben Sie an info@eloerp.net.