Inventory dashboard
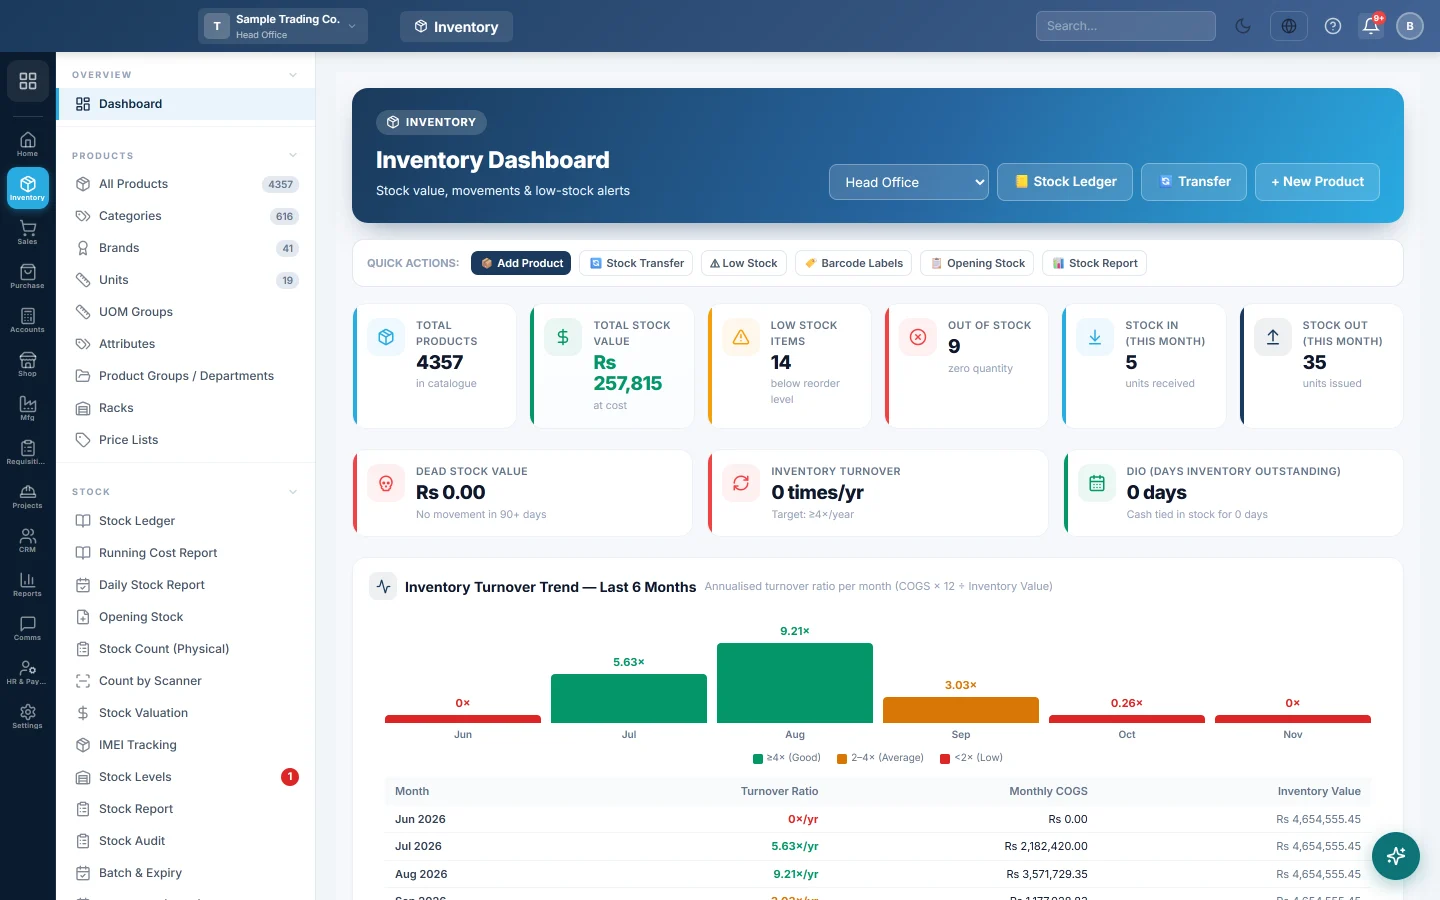
The first page of Inventory, with stock value, low and out-of-stock counts, monthly movement, turnover, dead stock and quick links to the stock screens.
The Inventory dashboard shows the health of your stock on one page: what it is worth, what is running low, what has stopped moving and how fast stock turns over. Use it each morning to decide what to reorder and what to clear.
Before you begin
- Products must have a Cost Price, or the stock value shows as zero. See All Products.
- Give products a Reorder Level if you want them counted as low stock.
- Stock comes from purchases, Opening Stock, Stock Adjustments and Stock Transfers.
Where to find it
Open Inventory → Overview → Dashboard. It is also the page you land on when you click the Inventory icon in the module rail.
Read the KPI cards
The first row has six cards:
| Card | What it shows |
|---|---|
| Total Products | Products in your catalogue. |
| Total Stock Value | Stock on hand valued at cost. |
| Low Stock Items | Products with stock above zero but below their reorder level. |
| Out of Stock | Products with zero or less in stock. |
| Stock In (This Month) | Units received this month. |
| Stock Out (This Month) | Units issued this month. |
The second row has three cards:
- Dead Stock Value: the cost of stock with no movement in 90 days or more.
- Inventory Turnover: how many times a year your stock sells through. The target is 4 times or more; the card turns amber below 4 and red below 2.
- DIO (Days Inventory Outstanding): how many days of stock you hold. Up to 60 days is green, up to 90 is amber, more is red.
Use the charts
- Inventory Turnover Trend — Last 6 Months shows the turnover for each month, with a table of Monthly COGS and Inventory Value below it.
- Stock Value by Category shows which categories hold your money. Hover over a slice to see its value.
- Stock Movement compares Stock In and Stock Out for the last 6 months.
- Under Advanced Analytics, ABC Product Analysis splits products into A (top 80% of value), B (next 15%) and C (bottom 5%).
- Stock Health shows the share of products that are healthy, low or out of stock.
- Stock Turnover by Category compares categories against a 4× target line.
- Stock Distribution by Warehouse shows the value in each warehouse, split by category.
Find dead stock
- Scroll to Dead Stock Alert.
- Click 30 days, 60 days or 90 days to choose how long without movement counts as dead.
- Read the Value Tied column and the Total Value Tied Up at the bottom.
- Plan a discount or a return to the supplier for the items at the top.
Act on low stock
- Scroll to Low Stock Alerts. Red rows are out of stock; yellow rows are below their reorder level.
- Click a product name to open it in a new tab.
- Raise a purchase order or a stock transfer from a warehouse that has it.
Other buttons on the page
- + New Product and Add Product open the product form.
- Stock Ledger opens the Stock Ledger.
- Transfer and Stock Transfer open Stock Transfers.
- Opening Stock opens Opening Stock.
- Stock Report opens Stock Levels.
- The tiles below the charts link to Products, Categories, Brands, Units, Stock Ledger, Stock Report, Stock Valuation, Physical Count, Opening Stock, Stock Transfer and Print Barcodes.
Common questions
Total Stock Value is zero but I have stock. The value is quantity × cost. Products without a Cost Price, or opening stock entered without one, are valued at zero.
Why is a product not in Low Stock Alerts? A product only counts as low when it has a Reorder Level above zero and its stock is below it. Set the level on the product form.
Can I see one branch only? If you can see more than one branch, a branch list appears at the top right. Pick a branch, or All Branches for the total.
The turnover cards show 0. Turnover needs sales with a cost of goods sold. A new company with no sales yet shows 0.
Where do I check a single product's movements? Open the Stock Ledger and pick the product.
谢谢。 如果仍需帮助,请发邮件至 info@eloerp.net。